Category: Trade Setups

Navellier Top stocks for April

The following is provided by Navellier with technical comment from South Ocean Management – pls do your own due diligence.
(For this 2020 year, SOM will track only the Top 5 Hi-Growth Investments.)

https://navelliergrowth.investorplace.com/

Navellier says,

High-Growth Investments

Brown & Brown, Inc.

Brown & Brown, Inc. (BRO) is the sixth-largest insurance brokerage in the U.S., and we added it to the High-Growth Investments Buy List in the March Growth Investor Monthly Issue. You may recall that Brown & Brown was founded to help its community better protect their most-valued assets. And, in light of the coronavirus pandemic, the company is offering resources to help individuals and businesses better navigate the risks of the current environment.

Brown & Brown offers live stream informative sessions to discuss the evolving risks of the coronavirus pandemic. On the company’s website, businesses also have access to a slew of resources from checklists for evaluating employee benefits to insurance coverage related to COVID-19 claims. Clearly, Brown & Brown is helping keep its customers informed during these uncertain times.

Brown & Brown’s focus on its customers and support of the local community have added to the company’s success over the past 81 years. It should also play a key role in generating customer loyalty and add to the company’s future success.

For the first quarter, analysts’ earnings forecasts have remained fairly steady. Brown & Brown is expected to report earnings of $0.46 per share, or 12.2% annual earnings growth. And full-year 2020 earnings forecasts have actually been revised higher in the past two months. BRO is a Conservative buy below $39.

SOM Technicals:

3-27-20:  Closed at 35.93. Trade pressures are rising into the neutral zone. Volumes are bullish. Need a close above 36.10 to start a new move up.

4-4-20: Closed at 33.41. Trade pressures are down. Volumes are bearish. The next target down is the 30.70 prior low.

4-11-20: Closed at 39.03. Trade pressures are up. Volumes are bullish. In the move up, the next target up is 44.85.

4-17-20: closed at 38.10. Trade pressures are down into the neutral zone. Volumes are bullish. Consolidating at the 200 day MA.


Copart, Inc.

Copart, Inc. (CPRT) is our leading online auctioneer for vehicles, with more than 200 pick-up locations in 11 countries around the world. In 2019, Copart had more than two million unique international visitors to its sites. And, given the “social distancing” and “stay-at-home” policies, even more folks may be turning to Copart’s online options if they’re in need of a vehicle.

All of Copart’s auctions are conducted online, so there hasn’t been any adjustments to the company’s normal auction schedules. But, to keep up with demand and maintain its employees and customers’ safety, Copart encourages users to download its mobile app. The app will allow customers to pay for their vehicle online, schedule vehicle pickups, acquire vehicle titles and review vehicle condition reports.

Since Copart’s operations are continuing fairly normally, there should be little impact to the company’s top and bottom lines. For the company’s third quarter in fiscal year 2020, the consensus estimate calls for earnings of $0.74 per share on $606.85 million in revenue. That represents 12.1% annual earnings growth and 9.7% annual revenue growth. CPRT is a Moderately Aggressive buy below $77.

SOM Technicals:

11-22-19: Closed at 89.26. Trade pressures are up. Volumes are neutral. In the uptrend. The next target up is 95.56.

11-30-19: Closed at 89.00. Trade pressures are up but declining. Volumes are neutral. The next target up is 94.81.

12-7-19: Closed at 88.58. Trade pressures are in the neutral zone. Volumes are bearish. Still in the uptrend.

12-12-19: Closed at 88.62. Trade pressures are up. Volumes are neutral.. The next target up is 94.81.

12-21-19: Closed at 90.72. Trade pressures are down into the neutral zone. Volumes are bullish. the next target up is 94.81.

1-4-20: Closed at 92.66. Trade pressures are up. Volumes are bullish. The next target up is 94.81.

1-18-20: Closed at 97.12. Trade pressures are up but turning down. Volumes are bullish. Consolidating at the 84.81 target.

1-25-20: Closed at 100.29. Trade pressures are up. Volumes are bullish. The next target up is 108.17.

1-31-20: Closed At 101.46. Trade pressures are up but declining. Volumes are bearish. Still in the move up. 98.97 would trigger a sell.

2-7-20: Closed at 102.58. Trade pressures are up but diverging. Volumes are bullish. A close below 98.97 would signal lower.

2-16-20: Closed at 103.25. trade  pressures are down into the neutral zone. Volumes are bullish. A close below 98.97 would signal lower.

2-23-20: Closed at 95.25. Trade pressures are down. Volumes are neutral. The downside target at 90.82 held as support. The next target down is 90.82.

2-29-20: Closed at 84.48. Trade pressures are down. Volumes are bullish. At the 200 day MA. A close above 87.30 would signal higher.

3-6-20: Closed at 80.19. Trade pressures are down but rising. Volumes are bearish. Just below the 200 day MA.

3-14-20: Closed at 73.84. Trade pressures are down but rising. Volumes are now bullish.at the 1.62% down side target. Need a close above 75.87 to move higher.

3-21-20: Closed at 60.15. Trade pressures are down but rising. Volumes are bearish. The next target down is 55.67. need a close above 67.12 to restart any move up.

3-27-20: Closed at 70.30. Trade pressures are up. Volumes are bullish. Traded up after the touch of the lower median line. Now in the new move up from the 69.91 long entry.

4-4-20: Closed at 61.80. Trade pressures are down. Volumes are bearish. Down hard from the new long entry. stop at the prior low of 55.69.

4-11-20: Closed at 74.99. Trade pressures are up. Volumes are bullish. The next target up is the 200 day at 83.23.

4-17-20: Closed at 72.10. Trade pressures are rising into the neutral zone. Volumes are neutral. Sitting on the new long entry price of 69.95


Invitation Homes, Inc.

Invitation Homes, Inc. (INVH) offers quality single-family rental homes in 17 popular U.S. cities, including Chicago, Denver, Las Vegas, Orlando, Phoenix, Seattle and Tampa. The company currently has more than 80,000 homes in its portfolio, with convenient locations to jobs and high-quality school districts.

The low mortgage rate environment has made home ownership attractive to many Americans. But others are still hesitant to buy, especially given the uncertainty surrounding the coronavirus outbreak in the U.S. and questions about when the country will be operating at normal levels again. As a result, home rentals remain in strong demand right now.

Analysts are foreseeing some impact to Invitation Homes business and have lowered earnings forecasts for the first quarter in the past month. But the company is still expected to report earnings of $0.05 per share and sales of $444.6 million, or 25% annual earnings growth and 2.1% annual sales growth.

I should add that Invitation Homes also continues to reward its shareholders. In January, the company increased its quarterly dividend by 15%. The stock currently has a 3.7% dividend yield. So, I expect yield-hungry investors to pour into INVH in the coming weeks. INVH is a Conservative buy below $22.

SOM Technicals:

2-29-20: Closed at 28.69. Trade pressures are down. Volumes are bullish. Consolidating now at 27.96,  the 200 day MA.

3-6-20. Closed at 29.54. Trade pressures are down into the neutral zone. Volumes are bullish. The 200 day MA at 29.11 seems to hold.

3-14-20: Closed at 27.95. Trade pressures are down but rising and showing some divergences. Volumes are neutral. After spiking down to 22, price has closed above a new long entry at 25.15.

3-21-20: Closed at 17.19. Trade pressures are down. Volumes are bearish. The next target down is 13.50. Need a close above 20.02 to restart a move up.

3-27-20: Closed at 20.81. Trade pressures are up into the neutral zone. Volumes are bullish. The close above 18.79 triggered the new long entry.

4-4-20: Closed at 19.37. Trade pressures are down into the neutral zone. volumes are neutral. In the move up from the 18.70 entry the next target up is 23.90.

4-11-20: Closed at 19.37. Trade pressures are down into the neutral zone. Volumes are now neutral. The retracement is now back to the long entry price of 18.79.

4-17-20: Closed at 23.82. Trade pressures are down into the neutral zone. Volumes are neutral. At the 23.90 upside target. The next target up is 29.00.


ResMed, Inc.

ResMed, Inc. (RMD) was also one of our new buys in the March Growth Investor Monthly Issue. ResMed, which is short for Respiratory Medicine, manufactures CPAP masks, machines and other life support ventilators for in-home use. With operations in more than 120 countries around the world, the company strives to help individuals with chronic respiratory diseases.

Given that the individuals with respiratory diseases are more at-risk to the coronavirus, it’s not too surprising that ResMed has stepped up to help combat the disease. The company has more than 7,500 employees around the world collaborating with hospitals, physicians, health authorities and governments. Respiratory equipment and ventilators have been in top demand.

ResMed has also stated that it will double—possibly triple—its production of ventilators, as well as produce 10 times more ventilation masks. These efforts will go a long way to helping treat patients with the coronavirus throughout the world.

The boost in production should also add to the company’s top and bottom lines. For the first quarter, the analyst community is looking for earnings of $1.05 per share, or 18% annual earnings growth, and revenue of $726.65 million in revenue. Analysts have also upped earnings forecasts over the past two months. RMD is a Conservative buy below $151.

SOM Technicals:

3-27-20: Closed at 141.95. Trade pressures are up. Volumes are bullish. In the new move up from the 129.46 long entry price.

4-4-20: Closed at 152.97. Trade pressures are up into the neutral zone. Volumes are bullish. The next target up is 1182.81.

4-11-20: Closed at 152.97. Trade pressures are up into the neutral zone. Volumes are bullish. The next target up is 182.81.

4-17-20: Closed at 165.16. Trade pressures are up. Volumes are bullish. The next target up is the 177.99 prior high.


S&P Global, Inc.

S&P Global, Inc. (SPGI) provides vital financial information through its multiple divisions, including S&P Market Intelligence, S&P Global Ratings, S&P Dow Jones Indices and S&P Global Platts. In the current environment of economic and financial uncertainty, S&P Global is relied heavily on for data, credit ratings and custom indices.

S&P Global mines through more than 135 billion data points from around the world. Its analysts and systems process the data to uncover critical information and to provide strategic analysis. As a result, S&P Global’s resources are in top demand and deemed necessary to navigate today’s bumpy landscape.

For the first quarter, S&P Global is expected to report earnings of $2.35 per share and revenue of $1.69 billion. That translates to 7.9% annual revenue growth and 11.4% annual earnings growth. The company also recently paid a quarterly dividend of $0.67 per share on March 11. The stock has a 1.2% dividend yield. SPGI is a Conservative buy below $258.

SOM Technicals:

12-21-19: Closed at 271.66. Trade pressures are rising into the neutral zone. Volumes are bearish. The next target up is 284.50.

1-4-20: Closed at 276.91. Trade pressures are up. Volumes are bullish. The next target up is 296.

1-18-20: Closed at 296.79. Trade pressures are up. Volumes are bullish. The next target up is 303.26.

1-25-20: Closed at 294.83. Trade pressures are up but declining. Volumes are neutral. 25×5 support is at 283.52.

1-31-20: Closed at 293.73. Trade pressures are down. Volumes are bearish. The next target up is 303.26.

2-7-20: Closed at 295.48. Trade pressures are rising into the neutral zone. Volumes are bearish. The next target up is 303.26. Support is at 286.

2-16-20: Closed at 307.65. Trade pressures are up. Volumes are bullish. At the 303.26 target.

2-23-20: Closed at 293.25. Trade pressures are down. Volumes are bearish. The next target down is 283.00.

2.29.20: Closed at 265.91. Trade pressures are down. Volumes are bullish. At 257.02, the 200 day MA.

3-6-20: Closed at 271.06. Trade pressures are down into the neutral one., Volumes are bearish. The 200 day MA is 258.76.

3-14-20: Closed at 248.47. Trade pressures down but rising. Volumes are bullish. The spike down and reversal has brought price up to near the new long entry at 250-55.

3-21-20: Closed at 208.79. Trade pressures are down but rising. Volumes are bullish. The next target down is 183.24. Need a close above 222.94 start a new move up.

3-27-20: Closed at 240.16. Trade pressures are up. Volumes are bullish. In the new move up from the 222.94 long entry.

4-4-20: Closed at 238.80. Trade pressures are down into the neutral zone. In the move up the next target up is the 200 day MA at 259.87.

4-11-20: Closed at 283.03. Trade pressures are up. Volumes are bullish. The next target up is 312.94.

4-17-20: Closed at 282.73. Trade pressures are up. Volumes are bullish. The next target up is the old high of 312.94.

Intel (INTC) stopped out


INTCIntel is below both the 80 day and the 200 day, so this is a retracement trade. The dividend is 3.00% at current prices and should pay around August 7th.

Weekly trade pressures are down. Weekly volume is still bearish.

Daily trade pressures are down but rising and ready to cross into positive territory. Volume is bullish.

The trade entry price is 32.22. The actual trade entry is 32.38.

The first target is 34.30. Since this is a retracement trade this first target will be the exit.

Stops at 31.60, which is also the new short entry.

[Update 7/6: this trade was stopped out at the open on 6/26 @31.51. A loss of $.87, or -2.7%.]
Reynolds American (RAI) [sell at target]

RAITrade pressures are down but rising. Volume is bullish changed from neutral.  Now testing the 80 day moving average as resistance. Expect upside follow thru from this 3.7% dividend stock.

The long entry price is 73.20.
The first target is 77.12.
Stops at 70.74

[6/18: two days of upward momentum and bullish volume approaching the first target. Move the stop to the entry price of 73.20.]

[6/19: Friday morning run to the first target of 77.12. Sold here with the weekend and the Greek situation still in the headlines.
A 5.3% return in 3 days!
And a risk free trade after the second day when stops were raised to the entry price.]

Euro Futures [closed-targets met]

Euro – June futures contract_

Weekly – Trading between 1.043 and the weekly long entry confirmation of 1.092. Trade pressures are still negative but rising. Volume is bearish. a break of the lows would set up a .9745 downside weekly target.

Daily – Two long trade cycles working. One is long from 1.0765. the other shorter cycle long from 1.0663 this last week, resulting in targets of 1.0860 and 1.1097.

Trade pressures are down but rising. Volume is bullish for four days of last week.

Stops at 1.0529.

[5/3 update: closed the trade at the 1.1262 target.]

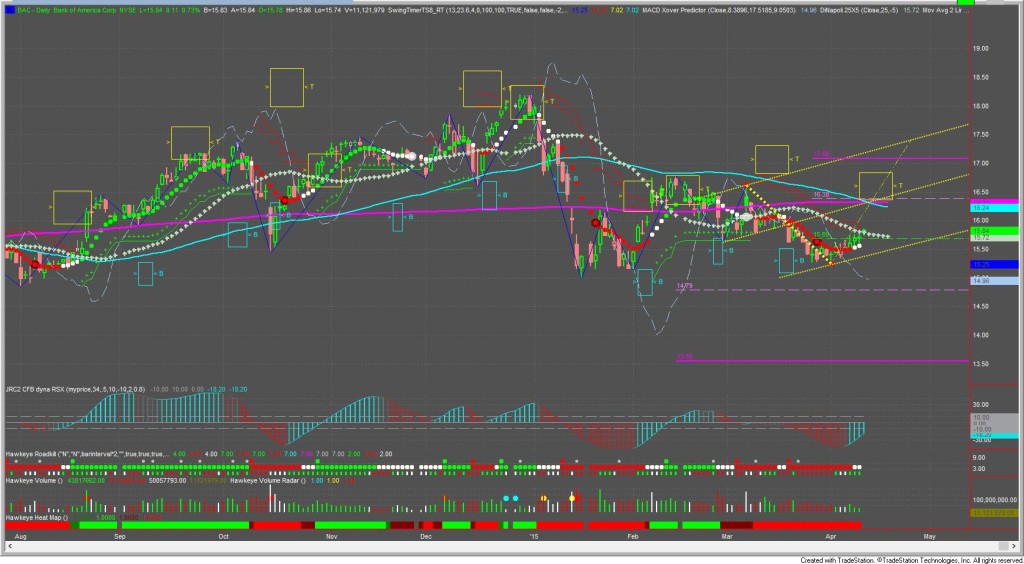
Bank of America [sold for 7.1% gain in 54 days]

Weekly – Trade pressures are down. Volume has changed to Neutral from Bearish. Earnings report on 4/15 pre-market.

Daily – Trade is long from 15.69 with a first target of 16.38. Trade pressures are down, but rising.
Volume is bullish.

Stops at 15.26 at the pivot low.

BAC


[5/4 Update: raise stops to break-even @15.69. The 16.38 target is also the 200 day moving average.
Next target up after 16.38 is 17.08.
3:00pm: closed above the 16.38 target. If not already sold, move target to the 17.08]

[5/21: Sell at the 17.08 level. Raise the stop to 16.08.]

BAC

[6/3:Raise stops to 16.81, sell the 17.08 target]

BAC

[6/5: stopped out at the 16.81 level at the open and then closes at 17.22.
So, a 54 day trade gains 1.12, or 7.1% in a difficult market environment.
The stop was raised to break-even on 5/4, so a risk-less trade from then to now.]

30YR T-Bonds

http://www.thestreet.com/story/13098988/1/doug-kass-says-the-bull-market-in-bonds-will-end-this-year.html?kval=dontmiss

The Weekly trade pressures are still up. Weekly volume closed bullish last week and will likely close bullish this week, albeit with substantially lower volume.

The Daily trade is long from the 158-10/32 entry price, meeting the first and 100% targets, and is now attempting to test the prior 167-18/32 high.

There is a 167.90 target above that would likely resist any breakout.

Long? Take profits.

Short? Yes, but at our 163-21/32 short entry. Or, the most aggressive can fade that 167.90 resistance with tight stops.

[Update 5/4: the 158-21 downside target offered no resistance. The next target down is 153-28. 159-27 is the stop and possible new long entry.]

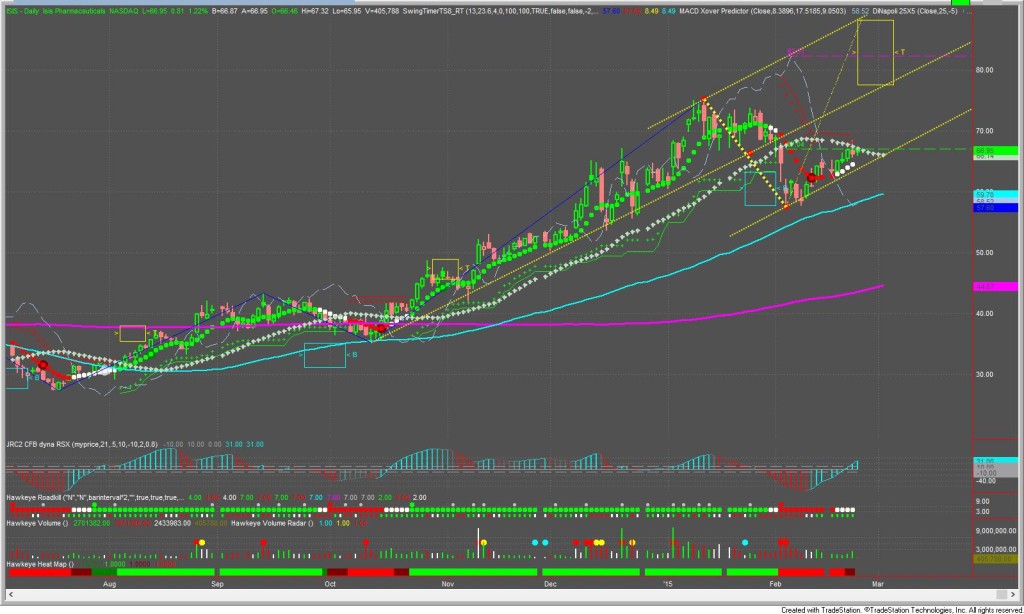
ISIS Pharmaceuticals

ISISISIS Pharmaceuticals reports Friday morning the 27th.

Weekly – in a pullback inside the longer term uptrend. trade pressures have been declining but remain positive. Volume is bearish .

Daily –  the trade is long from the 67.04 entry price. Trade pressures are up. Volume is bullish. The next target up is 82.31.

This is a longer cycle trade so expect to hold this for this earnings report and into the next.  The stop is the 80 day, 59.70 currently.

there is a short cycle target at 70.89 with a closer in stop at 63.09.

[Update 3/5/2015: move sell stop to the entry price of 67.04.  The short cycle target of 70.83 has been met. The next target is 75.65 and the Jan’15 highs of 75.10.  The volatility is high with 2-3 point daily trading ranges. OK to take profits on any wide ranging up day.]

[Update 3/6/2015: SOLD @ 71.50. A profit of $4.46 which equals a 6.65% return in less than two weeks. S&P turning down with worries of interest increases.  We will come back to this trade later.]  ISIS


EUFN – the exit

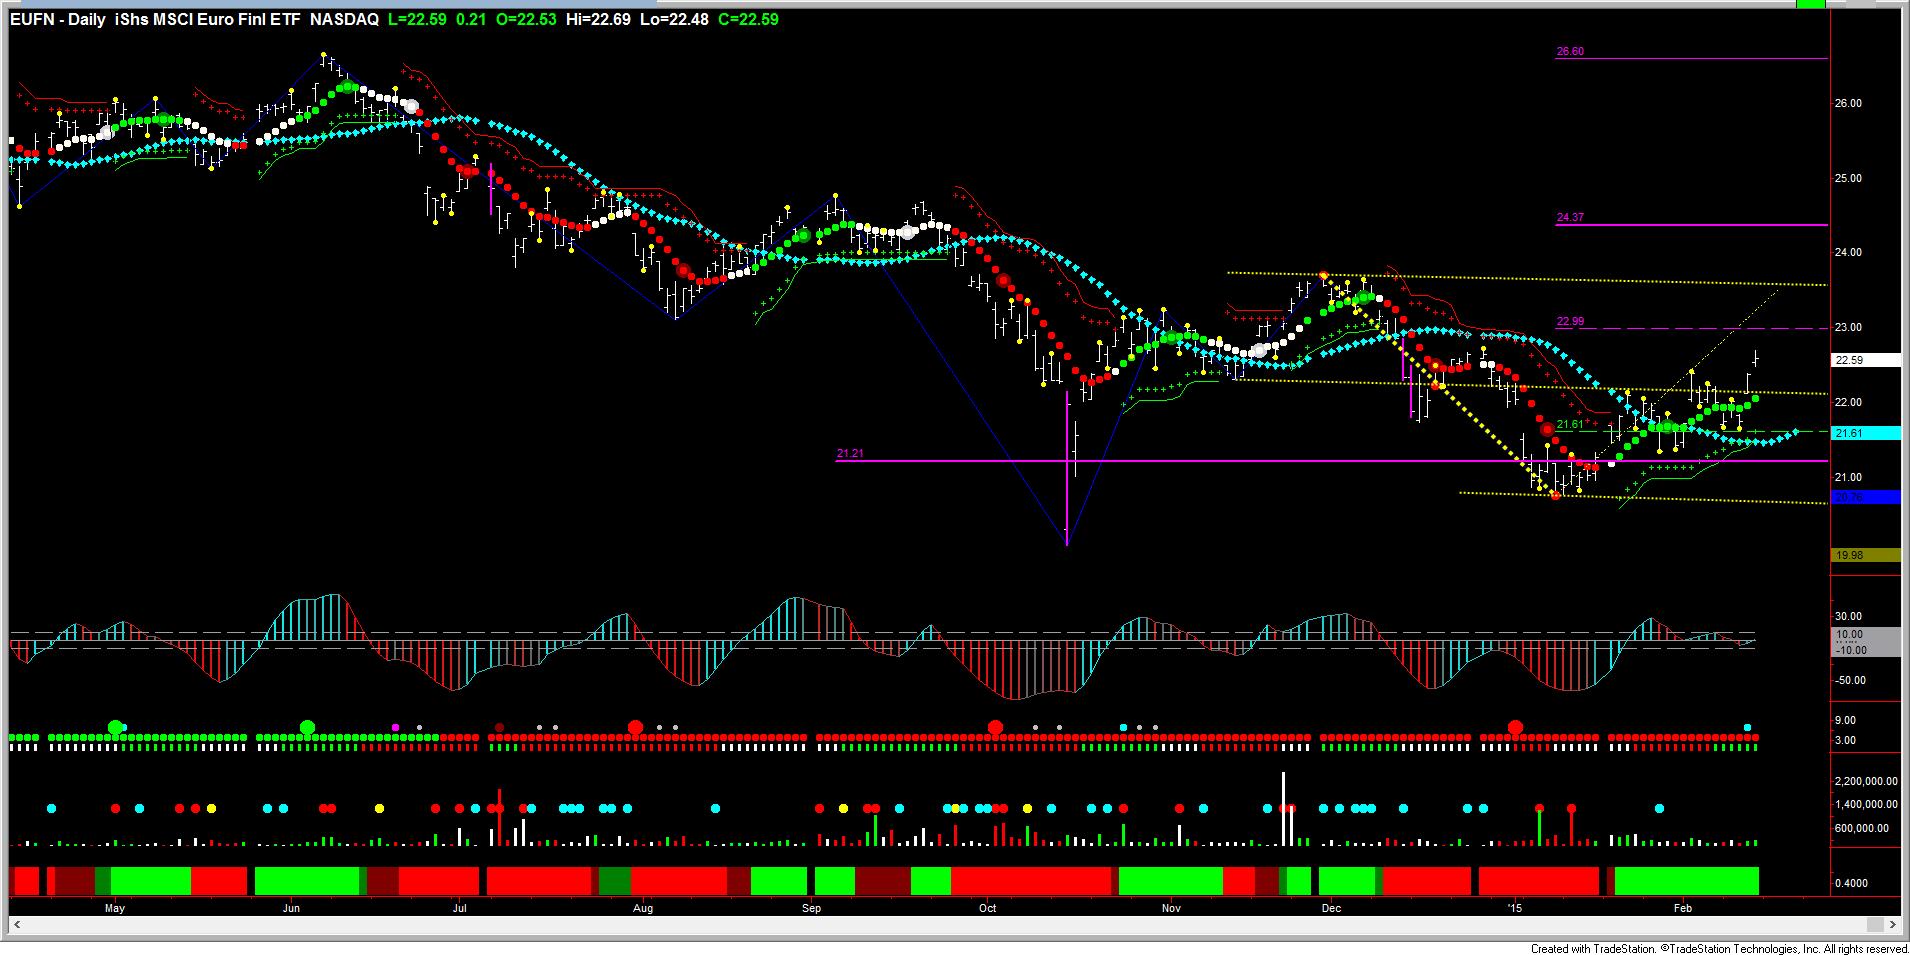
EUFN-3Weekly – three weeks of bullish volume. A close above 23.56 would change the weekly trend to up.  The announcement of the short term debt extension for the Greeks firmed up the move.

So, this Daily move up is still a correction in a weekly down trend.

Daily – Volume is bullish. Trade pressures are up. The trade has closed above the 22.96 target. The temporary nature of the Greek financing agreement makes us believe we will see another move down and then look for a longer term move up from this expected correction. So, this target was the trade exit. The first target has a higher percentage of success with the upper time frame not confirming the trade time frame.

Keep this ETF on the watch list.

So a long entry at 21.61, an exit at 22.96, with good trade management produces $1.35 (6.2%) gross profit in less than 20 days. Can you do this every month? Every trade? No.

INTC

INTCWeekly – Trade pressures are down. Volume has turned neutral. INTC Has completed the move down to the weekly 31.99 target.

Daily – Trade pressures have turned up. Volume is bullish. The long entry price is 34.56. the next target up is 37.71.  The trade will be wrong if price closes below the 200 MA, currently 33.20.  Price has closed above the long entry price once in the last three days. A second time thru should confirm the long entry. Watch the intraday charts for the reversal.

Use that 200 MA level as the stop.

[Update: 2/23] No entry. price is pulling back to the 200 Day MA and showing positive divergence. Bullish volume and Positive trade pressures. Watch for a “wash and rinse” at the 200 day.

[Update 3/12/2015:] Cancel the trade. No entry as the price failed to close above the long entry price. Now the price has closed below the 200 day and prior pivot points – A good view of the South Ocean method keeping us out of a trade.

EUFN [update] Euro Financials

Trade pressures still neutral. Weekly volume has been bullish for two weeks. Daily volume has turned bullish after three days of a pullback, closing at 22.59 near the first target of 22.96.

South Ocean first moves the stop to the entry price of 21.61 So, the trade now has no risk with the stop at the entry price. Then would take this first target gain at 22.96 as the momentum indicators seem listless.   But, review the indicators when price reaches target and make the sell decision.

EUFN-2