Featured
Market Summary:
Copper new long off support. Gold and Silver are consolidating lower.
Crude second attempt at a new move up. Natural Gas move down.
The US 30yr Treasury down as the 10yr yield rises to 4.59%.
The expected overbought level for the 10yr yield rises to 4.62%.
The US Dollar – The USD has small correction.
_________________
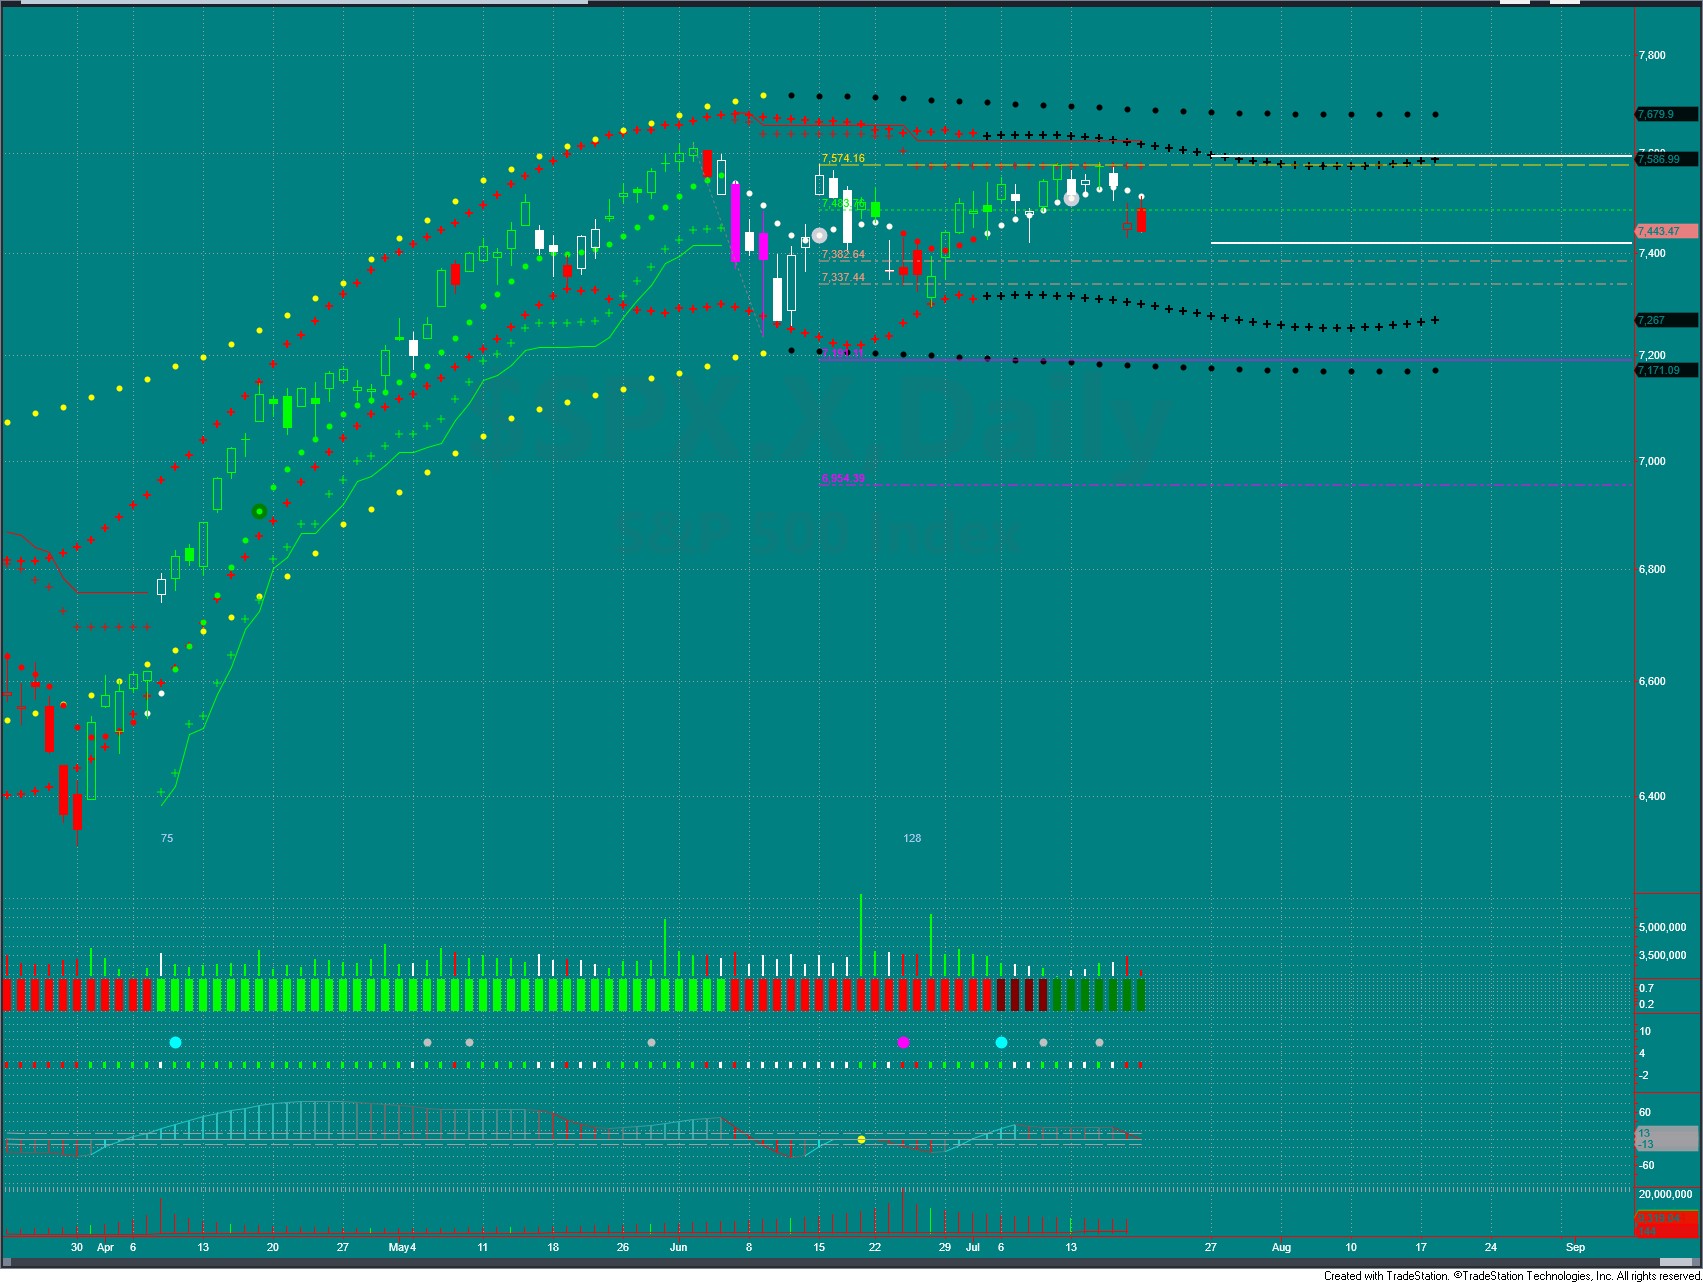
S&P 500 Futures #ESU26, #MESU26
Monthly –Monthly bar continues lower off the prior month highs. Trade pressures remain up, Volumes closed the month of June as bullish. The 7694 price remains the adjusted high. The next target up is 8684. A close below 7384 would confirm any weekly move lower.
Weekly – The weekly bar makes a lower high. Trade pressures remain up, but declining. Volumes are bullish. The next target down is 7325. The close below the 7325 median line support did confirm the daily move lower. A close above 7642 would confrim a daily move higher.
Daily – Flat. Lower highs followed by the SL on 7/13. Trade pressures are down, Volumes are bearish.
The next target down is 7333. The expected oversold level rises to 7420.
A close above 7560 would signal higher. The expected overbought level declines to 7597.
[OB/OS trend is narrowing.]
The VIX closes below 19, at 18.65 indicating market is moving toward trending.
The Hedgeye.com VIX risk range is 15.37 – 19.41.
[7-13-26: Stopped out of the long at 7551.]
[7-20-26: Look to short near OB levls.]
__________________
Navellier Top 5 Stocks – This Top 5 model portfolio begins each year at $100,000. The Top 5 Growth stocks are tracked throughout each year. This portfolio is reset to $100,000 for the 2026 year.
These Navellier Top 5 portfolio stocks closed:
Down 35% for the 2022 Year.
Up 17% for the 2023 Year.
Up 42% for the 2024 Year.
Up 48% for the 2025 Year
Portfolio stock values for 2026.
The portfolio is in all cash, at $175,000.
The Year-to-Date portfolio performance is up 75%.
The Hedgeye.com GDP nowcast has GDP growth slowing in the 3rd quarter, re-accelerating in the 4th quarter and slowing once again in the 1st quarter of 2027.
Up 75% in the Navellier Top 5 for the first half of 2026 warranted profit taking. 6/26 – Now all cash for the summer; re-entering late July or early August, or re-entering if Navellier adds more defensive names.
The S&P 500 YTD return is 8.94%
#usdollarfutures #ustreasurybondfutures
USD_ DXU26
Weekly – In the March 2026 uptrend. Trade pressures are up, but declining. Volumes are now neutral.
Daily – Flat. Lower highs at 101.13. In the move down to 100.03 support. Trade pressures are up. Volumes remain bearish.
The next target down is 100.03. The expected oversold levels decline to 100.40.
A close above 100.83 would signal higher. The expected overbought level declines to 101.38.
[The OB/OS channel is declining.]
US30YR T-BOND_ USU26
Weekly – In the March 2026 downtrend. Trade pressures are down. Volumes are bearish.
Daily – Flat. In the move down from 112-24 on 7/7. Trade pressures are down. Volumes remain bearish.
The next target down is 109-25. Oversold levels decline to 109-29.
A close above 111-13 would signal higher. Overbought levels decline to 112-08.
[The OB/OS channel is declining.]
Hedgeye indicates lower inflation resulting in no rate increases and is showing up in the longer end of the yield curve. when it shows up in the 2yr then markets will react. 10yr yields rise to 4.48%. The yield overbought level declines to 4.46.
#crudeoilfutures #naturalgasfutures
CRUDE_ CLQ26
Weekly – In the new June 2026 down trend, rising off support. Trade pressures are up. Volumes are now neutral.
Daily – Long. In the new move up from 72.11 on 7/13. Trade pressures are up. Volumes are bullish.
The next target up is 87.16. The expected overbought levels rise to 85.71.
A close below 77.30 would signal lower The expected oversold level rises to 69.89.
[OB/OS channel is rising.]
OVX (oil volatility) up to 62.
(One of the larger components in the measure of inflation.The Hedgeye.com inflation nowcast now expects inflation declining into the August meeting.)
NAT GAS_ NGQ26
Weekly – In the January 2025 uptrend. Trade pressures are down. Volumes are bearish.
Daily – Flat, Stopped out of the long at 3.23 on 7/9. Trade pressures are down. Volumes remain bearish.
The next target down is 2.47. The expected oversold level declines to 2.69.
A close above 2.91 would signal higher. The expected overbought level declines to 3.06.
[OB/OS channel is declining.]
Natural gas is produced with oil production. Natural gas production as a ratio of oil production has been rising, amounting to 47% of the Permian Basin oil production in 2024.
#copperfutures #goldfutures #silverfutures
COPPER_ HGU26, MHGU26
Weekly – In the October 2025 uptrend. Trade pressures are up. Volumes remain bearish.
Daily –Flat. The breakout at 6.27 on 7/13 was successful. Rallied to the resistance at 6.46. Pulled back to thest the support at 6.18. Trade pressures are down. Volumes are bullish.
The next target up is 6.41. The expected overbought levels rise to 6.41.
A close below 6.17 would resume the move down. The expected oversold levels rise to 6.05.
[OB/OS channel is rising.]
[7-20-26:set the SL at 6.17.]
GOLD_ GCQ26, MGCQ26
Weekly – In the June 2026 down trend. Trade pressures remain down, rising slightly. Volumes remain bearish.
Daily – Flat. Consolidating at 3966 recent trading lows. Trade pressures are down. Volumes are bearish.
The close above 4151 signals higher. The next target up is 4235. The expected overbought level declines to 4136.
A close below 3987 would signal lower. The expected oversold level rises to 3942.
[OB/OS channel is narrowing.] GVX @ 25 = chop zone.
[7-20-26: Don’t want to trade long against the weekly downward pressures. no entry.]
SILVER_ SIU26
Weekly – In the June 2026 downtrend. Trade pressures remain down. Volumes remain bearish.
Daily – Short. In the new move down from the 60 trend break on 7/07. Trade pressures are down, but rising. Volumes are now neutral.
The next target down is 55.60 The oversold levels decline to 53.
A close above 57.51 would signal higher. Overbought levels decline to 60.
[OB/OS channel is declining.]
[7-20-26: Set the SL at 57.50.]
Market Summary:
Copper finds support at 6.05. Gold and Silver are consolidating after the failure hold the breakout of their bull flags.
Crude attempting a new move up. Natural Gas in sharp break down.
The US 30yr Treasury down as the 10yr yield rises to 4.54%.
The expected overbought level for the 10yr yield rises to 4.57%.
The US Dollar – The USD down.
_________________
S&P 500 Futures #ESU26, #MESU26
Monthly –Monthly bar down off the prior month highs. Trade pressures remain up, Volumes closed the month of June as bullish. The 7694 price remains the adjusted high. The next target up is 8684. A close below 7384 would confirm any weekly move lower.
Weekly – The weekly bar rallies again above the prior week. Trade pressures remain up. Volumes are bearish. The next target up is 7713. A close below the 7325 support would confirm any daily move lower.
Daily – Long. A break above the 6/1 downtrend line at 7580 is in process. Buy any pull back to the breakout line. Trade pressures are up into the neutral zone, Volumes are bullish.
A close above 7580 would signal higher. The expected overbought level rises to 7605.
A close below 7551 would signal lower. The expected oversold level rises to 7353.
[OB/OS trend is rising.]
The VIX closes below 19, at 15.80 indicating market is moving toward trending.
The Hedgeye.com VIX risk range is 14.90 – 18.36.
[7-10-26: Set the SL at 7551.]
__________________
Navellier Top 5 Stocks – This Top 5 model portfolio begins each year at $100,000. The Top 5 Growth stocks are tracked throughout each year. This portfolio is reset to $100,000 for the 2026 year.
These Navellier Top 5 portfolio stocks closed:
Down 35% for the 2022 Year.
Up 17% for the 2023 Year.
Up 42% for the 2024 Year.
Up 48% for the 2025 Year
Portfolio stock values for 2026.
The portfolio is in all cash, at $175,000.
The Year-to-Date portfolio performance is up 75%.
The Hedgeye.com GDP nowcast has GDP growth slowing in the 3rd quarter, re-accelerating in the 4th quarter and slowing once again in the 1st quarter of 2027.
Up 75% in the Navellier Top 5 for the first half of 2026 warranted profit taking. Now all cash for the summer; re-entering approaching the 4th quarter, or re-entering if Navellier adds more defensive names.
The S&P 500 YTD return is 10.20%
#usdollarfutures #ustreasurybondfutures
USD_ DXU26
Weekly – In the March 2026 uptrend. Trade pressures are up. Volumes remain bullish.
Daily – Flat. Turned down at resistance. Trade pressures remain down. Volumes are now bearish.
The next target down is 100.03. The expected oversold levels declines to 100.42.
A close above 100.83 would signal higher. The expected overbought level declines to 101.39.
[The OB/OS channel is declining.]
US30YR T-BOND_ USU26
Weekly – In the March 2026 downtrend. Trade pressures are down. Volumes are neutral.
Daily – Flat. In the move down from 112-24 on 7/7. Trade pressures are down. Volumes remain bearish.
The next target down is 109-25. Oversold levels decline to 110-15.
A close above 111-22 would signal higher. Overbought levels decline to 112-14.
[The OB/OS channel is declining.]
Hedgeye indicates lower inflation resulting in no rate increases and is showing up in the longer end of the yield curve. when it shows up in the 2yr then markets will react. 10yr yields rise to 4.48%. The yield overbought level declines to 4.46.
#crudeoilfutures #naturalgasfutures
CRUDE_ CLQ26
Weekly – In the new June 2026 down trend. Trade pressures remain down. Volumes remain bearish.
Daily – Flat. Remains in the move down from 92.53 on 6/05. Trade pressures rallied but now are down into the neutral zone. Volumes remain bearish.
The next target down is 66.78. The expected oversold level rises to 67.00.
A close above 72.11 would signal higher. The expected overbought levels declines to 74.19.
[OB/OS channel is widening.]
OVX (oil volatility) up to 45.
(One of the larger components in the measure of inflation.The Hedgeye.com inflation nowcast now expects inflation declining into the July meeting. Declining inflation occurs in both Quad 4 (defensive) and Quad 1 (goldilocks).)
NAT GAS_ NGQ26
Weekly – In the January 2025 uptrend. Trade pressures remain in the neutral zone. Volumes are bullish.
Daily – Flat, Stopped out of the long at 3.23 on 7/9. Trade pressures are up. Volumes are bearish.
The next target down is 2.47. The expected oversold level declines to 2.90.
A close above 3.01 would signal higher. The expected overbought level declines to 3.19.
[OB/OS channel is declining.]
Natural gas is produced with oil production. Natural gas production as a ratio of oil production has been rising, amounting to 47% of the permian basin oil production in 2024.
#copperfutures #goldfutures #silverfutures
COPPER_ HGU26, MHGU26
Weekly – In the October 2025 uptrend, selling down to support. Trade pressures are down. Volumes remain bearish.
Daily –Flat. The lower median line parallel failed at the 6.07 support. Attempting a breakout at 6.27. Trade pressures are up. Volumes are now bullish.
The next target up is 6.46. The expected overbought levels rise to 6.28.
A close below 6.19 would resume the move down. The expected oversold levels rise to 5.96.
[OB/OS channel is rising.]
[7-10-26: Now looking for a new long entry at a break out of 6.27.]
GOLD_ GCQ26, MGCQ26
Weekly – In the June 2026 down trend. Trade pressures remain down, rising slightly. Volumes remain bearish.
Daily – Flat. Consolidating at the 4013 target. Trade pressures are down but rising. Volumes remain bullish.
The close above 4151 signals higher. The next target up is 4215. The expected overbought level rises to 4198.
A close below 4020 would signal lower. The expected oversold level declines to 3900.
[OB/OS channel is widening.] GVX @ 28 = chop zone.
[7-10-26: Gold is a preferred asset class in Quad 4 (slowing GDP and slowing inflation). But, don’t want to trade long against the weekly downward pressures or, the rising dollar. no entry.]
SILVER_ SIU26
Weekly – In the June 2026 downtrend. Trade pressures are down. Volumes remain bearish.
Daily – Flat. In a new move up off the 56.13 low pivot on 6/26 is stalling. Trade pressures are down. Volumes are now bearish.
The next target up is 63.21, and a new long entry. Overbought levels decline to 64.
A close below 60.30 would signal lower. The oversold levels rise to 56.
[OB/OS channel is narrowing.]
Market Summary:
Copper finds support at 6.09. Gold and silver breakout of their bull flags.
Crude basing. Natural Gas in the third leg up.
The US 30yr Treasury down as the 10yr yield rises to 4.48%.
The expected overbought level for the 10yr yield declines to 4.46%.
The US Dollar – The USD remains a Long; but testing the 100.30 support.
_________________
S&P 500 Futures #ESU26, #MESU26
Monthly –Monthly bar down off the prior month highs. Trade pressures remain up, Volumes closed the month of June as bullish. The 7694 price remains the adjusted high. The next target up is 8684. A close below 7384 would confirm any weekly move lower.
Weekly – The weekly bar rallies to reclaim the prior week move down into the 4th of July holiday. Trade pressures remain up. Volumes are bearish. The next target up is 7713. A close below the 7325 support would confirm any daily move lower.
Daily – Flat. The move down from 6/15 has been recovered, but needs to break above the 6/1 downtrend line at 7580 . Trade pressures are up but declining, Volumes are bearish.
The next target down is 7384. The expected oversold level rises to 7296.
A close above 7580 would signal higher, but is higher than the OB. The expected overbought level declines to 7565.
[OB/OS trend is narrowing.]
The VIX closes below 19, at 15.81 indicating market is moving toward trending.
The Hedgeye.com VIX risk range is 15.52 – 19.99.
[7-3-26: Market appears to be staying between the OB/OS limits.] [ which would suggest the OB is likely resistance.]
__________________
Navellier Top 5 Stocks – This Top 5 model portfolio begins each year at $100,000. The Top 5 Growth stocks are tracked throughout each year. This portfolio is reset to $100,000 for the 2026 year.
These Navellier Top 5 portfolio stocks closed:
Down 35% for the 2022 Year.
Up 17% for the 2023 Year.
Up 42% for the 2024 Year.
Up 48% for the 2025 Year
Portfolio stock values for 2026.
The portfolio value up for the week, at $175,000.
The Year-to-Date portfolio performance is up 75%.
The Hedgeye.com GDP nowcast has rising GDP growth, then slowing in the 3rd quarter then re-accelerating in the 4th quarter. Up 75% in the Navellier Top 5 for the first half of 2026 warranted profit taking. Now all cash for the summer; re-entering approaching the 4th quarter, or re-entering if Navellier adds more defensive names.
The S&P 500 YTD return is 9.52%