Featured
Market Summary:
Copper new long off support. Gold and Silver are consolidating lower.
Crude second attempt at a new move up. Natural Gas move down.
The US 30yr Treasury down as the 10yr yield rises to 4.59%.
The expected overbought level for the 10yr yield rises to 4.62%.
The US Dollar – The USD has small correction.
_________________
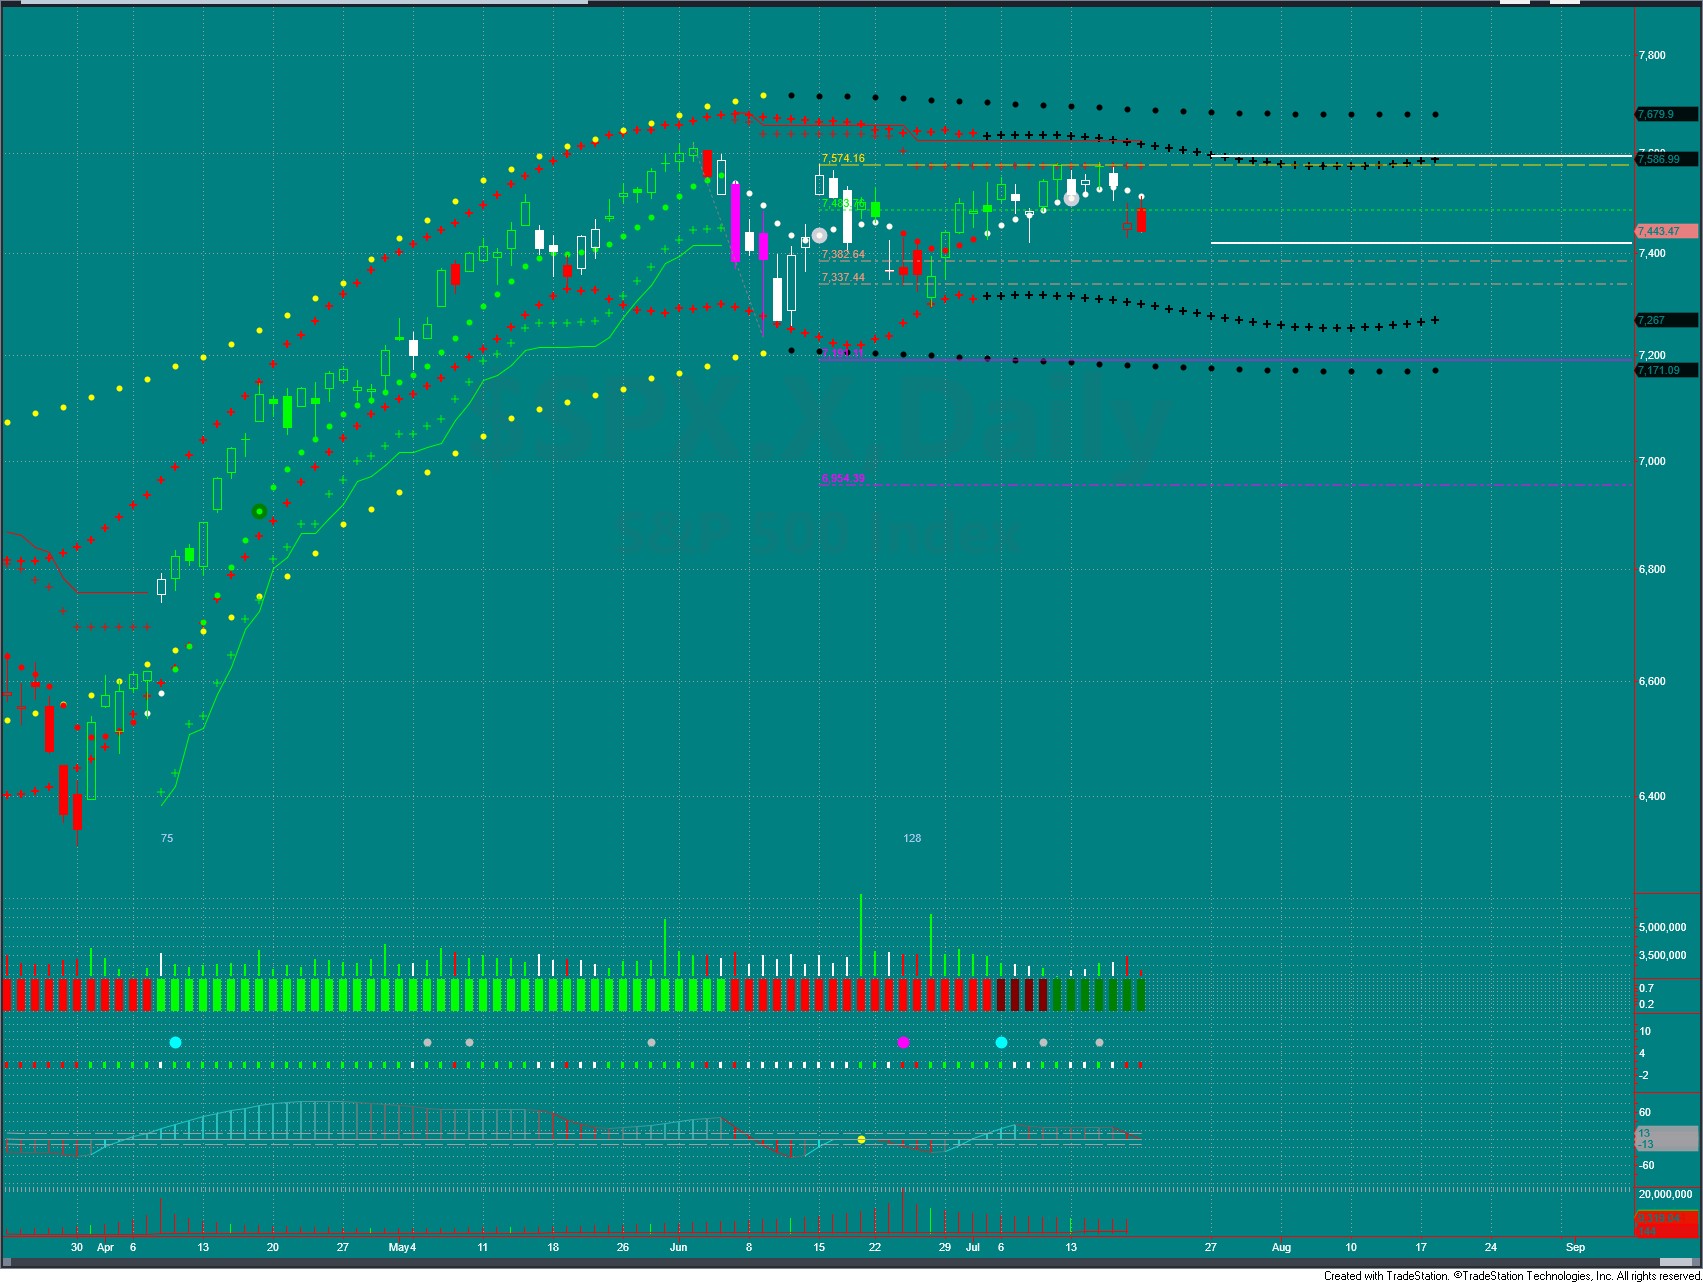
S&P 500 Futures #ESU26, #MESU26
Monthly –Monthly bar continues lower off the prior month highs. Trade pressures remain up, Volumes closed the month of June as bullish. The 7694 price remains the adjusted high. The next target up is 8684. A close below 7384 would confirm any weekly move lower.
Weekly – The weekly bar makes a lower high. Trade pressures remain up, but declining. Volumes are bullish. The next target down is 7325. The close below the 7325 median line support did confirm the daily move lower. A close above 7642 would confrim a daily move higher.
Daily – Flat. Lower highs followed by the SL on 7/13. Trade pressures are down, Volumes are bearish.
The next target down is 7333. The expected oversold level rises to 7420.
A close above 7560 would signal higher. The expected overbought level declines to 7597.
[OB/OS trend is narrowing.]
The VIX closes below 19, at 18.65 indicating market is moving toward trending.
The Hedgeye.com VIX risk range is 15.37 – 19.41.
[7-13-26: Stopped out of the long at 7551.]
[7-20-26: Look to short near OB levls.]
__________________
Navellier Top 5 Stocks – This Top 5 model portfolio begins each year at $100,000. The Top 5 Growth stocks are tracked throughout each year. This portfolio is reset to $100,000 for the 2026 year.
These Navellier Top 5 portfolio stocks closed:
Down 35% for the 2022 Year.
Up 17% for the 2023 Year.
Up 42% for the 2024 Year.
Up 48% for the 2025 Year
Portfolio stock values for 2026.
The portfolio is in all cash, at $175,000.
The Year-to-Date portfolio performance is up 75%.
The Hedgeye.com GDP nowcast has GDP growth slowing in the 3rd quarter, re-accelerating in the 4th quarter and slowing once again in the 1st quarter of 2027.
Up 75% in the Navellier Top 5 for the first half of 2026 warranted profit taking. 6/26 – Now all cash for the summer; re-entering late July or early August, or re-entering if Navellier adds more defensive names.
The S&P 500 YTD return is 8.94%
Market Summary:
Copper finds support at 6.05. Gold and Silver are consolidating after the failure hold the breakout of their bull flags.
Crude attempting a new move up. Natural Gas in sharp break down.
The US 30yr Treasury down as the 10yr yield rises to 4.54%.
The expected overbought level for the 10yr yield rises to 4.57%.
The US Dollar – The USD down.
_________________
S&P 500 Futures #ESU26, #MESU26
Monthly –Monthly bar down off the prior month highs. Trade pressures remain up, Volumes closed the month of June as bullish. The 7694 price remains the adjusted high. The next target up is 8684. A close below 7384 would confirm any weekly move lower.
Weekly – The weekly bar rallies again above the prior week. Trade pressures remain up. Volumes are bearish. The next target up is 7713. A close below the 7325 support would confirm any daily move lower.
Daily – Long. A break above the 6/1 downtrend line at 7580 is in process. Buy any pull back to the breakout line. Trade pressures are up into the neutral zone, Volumes are bullish.
A close above 7580 would signal higher. The expected overbought level rises to 7605.
A close below 7551 would signal lower. The expected oversold level rises to 7353.
[OB/OS trend is rising.]
The VIX closes below 19, at 15.80 indicating market is moving toward trending.
The Hedgeye.com VIX risk range is 14.90 – 18.36.
[7-10-26: Set the SL at 7551.]
__________________
Navellier Top 5 Stocks – This Top 5 model portfolio begins each year at $100,000. The Top 5 Growth stocks are tracked throughout each year. This portfolio is reset to $100,000 for the 2026 year.
These Navellier Top 5 portfolio stocks closed:
Down 35% for the 2022 Year.
Up 17% for the 2023 Year.
Up 42% for the 2024 Year.
Up 48% for the 2025 Year
Portfolio stock values for 2026.
The portfolio is in all cash, at $175,000.
The Year-to-Date portfolio performance is up 75%.
The Hedgeye.com GDP nowcast has GDP growth slowing in the 3rd quarter, re-accelerating in the 4th quarter and slowing once again in the 1st quarter of 2027.
Up 75% in the Navellier Top 5 for the first half of 2026 warranted profit taking. Now all cash for the summer; re-entering approaching the 4th quarter, or re-entering if Navellier adds more defensive names.
The S&P 500 YTD return is 10.20%
Market Summary:
Copper finds support at 6.09. Gold and silver breakout of their bull flags.
Crude basing. Natural Gas in the third leg up.
The US 30yr Treasury down as the 10yr yield rises to 4.48%.
The expected overbought level for the 10yr yield declines to 4.46%.
The US Dollar – The USD remains a Long; but testing the 100.30 support.
_________________
S&P 500 Futures #ESU26, #MESU26
Monthly –Monthly bar down off the prior month highs. Trade pressures remain up, Volumes closed the month of June as bullish. The 7694 price remains the adjusted high. The next target up is 8684. A close below 7384 would confirm any weekly move lower.
Weekly – The weekly bar rallies to reclaim the prior week move down into the 4th of July holiday. Trade pressures remain up. Volumes are bearish. The next target up is 7713. A close below the 7325 support would confirm any daily move lower.
Daily – Flat. The move down from 6/15 has been recovered, but needs to break above the 6/1 downtrend line at 7580 . Trade pressures are up but declining, Volumes are bearish.
The next target down is 7384. The expected oversold level rises to 7296.
A close above 7580 would signal higher, but is higher than the OB. The expected overbought level declines to 7565.
[OB/OS trend is narrowing.]
The VIX closes below 19, at 15.81 indicating market is moving toward trending.
The Hedgeye.com VIX risk range is 15.52 – 19.99.
[7-3-26: Market appears to be staying between the OB/OS limits.] [ which would suggest the OB is likely resistance.]
__________________
Navellier Top 5 Stocks – This Top 5 model portfolio begins each year at $100,000. The Top 5 Growth stocks are tracked throughout each year. This portfolio is reset to $100,000 for the 2026 year.
These Navellier Top 5 portfolio stocks closed:
Down 35% for the 2022 Year.
Up 17% for the 2023 Year.
Up 42% for the 2024 Year.
Up 48% for the 2025 Year
Portfolio stock values for 2026.
The portfolio value up for the week, at $175,000.
The Year-to-Date portfolio performance is up 75%.
The Hedgeye.com GDP nowcast has rising GDP growth, then slowing in the 3rd quarter then re-accelerating in the 4th quarter. Up 75% in the Navellier Top 5 for the first half of 2026 warranted profit taking. Now all cash for the summer; re-entering approaching the 4th quarter, or re-entering if Navellier adds more defensive names.
The S&P 500 YTD return is 9.52%
Market Summary:
Copper finds support at 5.99. Gold and silver have will test the breakout of their bull flags.
Crude basing. Natural Gas in the second leg up.
The US 30yr Treasury Long and higher as the 10yr yield declines to 4.37%.
The expected overbought level for the 10yr yield declines to 4.50%.
The US Dollar – The USD is a Long; but testing the 100.80 support.
_________________
S&P 500 Futures #ESU26, #MESU26
Monthly –Monthly bar down off the highs. Trade pressures remain up, Volumes closed the month of May as bullish. The 7694 price is the adjusted high. The next target up is 8684. Very near a close below 7384 would confirm any weekly move lower.
Weekly – The weekly bar forms a lower high at 7658 and down this week. Trade pressures remain up. Volumes are now bearish. The next target up remains 7666. A close below the 7325 support would confirm any daily move lower.
Daily – Flat. In the move down off the lower high on 6/15 . Trade pressures are down, Volumes are bearish.
The next target down is 7325. The expected oversold level rises to 7286.
A close above 7445 would signal higher. The expected overbought level declines to 7568.
[OB/OS trend is narrowing.]
The VIX closes below 19, but rising; at 18.40 indicating market is moving toward chop.
The Hedgeye.com VIX risk range is 15.62 – 21.49.
[6-19-26: Market appears to be staying between these OB/OS limits.]
__________________
Navellier Top 5 Stocks – This Top 5 model portfolio begins each year at $100,000. The Top 5 Growth stocks are tracked throughout each year. This portfolio is reset to $100,000 for the 2026 year.
These Navellier Top 5 portfolio stocks closed:
Down 35% for the 2022 Year.
Up 17% for the 2023 Year.
Up 42% for the 2024 Year.
Up 48% for the 2025 Year
Portfolio stock values for 2026.
The portfolio value up for the week, at $175,000.
The Year-to-Date portfolio performance is up 75%.
The Hedgeye GDP nowcast has rising GDP growth, then slowing in the 3rd quarter then re-accelerating in the 4th quarter. Up 75% in the Navellier Top 5 for the first half of 2026 warrants profit taking. Now all cash for the summer; re-entering approaching the 4th quarter, or re-entering if Navellier adds more defensive names.
The S&P 500 YTD return is 7.48%
Market Summary:
Copper waiting for a new Long. Gold and silver have covered shorts and wait similarly .
Crude lower. Natural Gas in the second leg up..
The US 30yr Treasury Long and higher as the 10yr yield declines to 4.45%.
The expected overbought level for the 10yr yield rises to 4.57%.
The US Dollar – The USD is a Long. But Inflation expected lower.
_________________
S&P 500 Futures #ESU26, #MESU26
Monthly –Monthly bar holding, but looking toppy. Trade pressures remain up, Volumes closed the month of May as bullish. The 7694 price is the adjusted high. The next target up is 8684. A close below 7384 would confirm any weekly move lower.
Weekly – The weekly bar higher off the April ’25 median line which is support at 7286. Trade pressures remain up. Volumes remain bullish. The next target up remains 7686. A close below 7325 would confirm any daily move lower.
Daily – Flat. 6/15 Stopped out of the long trade at 7639 from 7433 on 6/11. Trade pressures are down but rising, Volumes closed neutral.
The next target down is 7448. The expected oversold level rises to 7253.
A close above 7670 would signal higher. The expected overbought level declines to 7590.
[OB/OS trend is narrowing.]
The VIX closes below 19 at 16.40, indicating market is investible.
The Hedgeye.com VIX risk range is 15.01 – 22.97.
[6-19-26: Market appears to be staying between these OB/OS limits. The OB is declining. Watch for a lower high.]
__________________
Navellier Top 5 Stocks – This Top 5 model portfolio begins each year at $100,000. The Top 5 Growth stocks are tracked throughout each year. This portfolio is reset to $100,000 for the 2026 year.
These Navellier Top 5 portfolio stocks closed:
Down 35% for the 2022 Year.
Up 17% for the 2023 Year.
Up 42% for the 2024 Year.
Up 48% for the 2025 Year
Portfolio stock values for 2026.
The portfolio value up for the week, at $171,000.
The Year-to-Date portfolio performance is up 71%.
The Hedgeye GDP nowcast has rising growth, then slowing in the 3rd quarter then reaccerating in the 4th quarter. Up 71% for the first half of 2026 warrants profit taking. So, at the next open, taking profits and going to all cash for the summer; re-entering approaching the 4th quarter, or re-entering if Navellier adds more defensive names.
The S&P 500 YTD return is 8.59%
Market Summary:
Copper now a new Long. Gold and silver have covered shorts.
Crude lower. Natural Gas breaks out above the bull flag.
The US 30yr Treasury Long and higher as the 10yr yield declines to 4.48%.
The expected overbought level for the 10yr yield declines to 4.56%.
The US Dollar – The USD is a Long. Inflation lower.
_________________
S&P 500 Futures #ESU26, #MESU26
Monthly –Monthly bar making new ATH’s with the rollover. Trade pressures remain up, but still declining. Volumes closed the month of May as bullish. The 7694 price is the adjusted high. The next target up is 8684. A close below 7384 would confirm any weekly move lower.
Weekly – The weekly bar higher off the April ’26 median line which is support at 7286. Trade pressures remain up. Volumes remain bullish. The next target up remains 7682. A close below 7325 would confirm any daily move lower.
Daily – Long. From 7433 on 6/11. Trade pressures are up, Volumes are neutral.
The next target up is 7572. The expected overbought level declines to 7619.
The next target down is 7262. The expected oversold level declines to 7222.
[OB/OS trend is declining.]
The VIX closes below 19 at 17.66, indicating market is investible, but near the chop/yellow zone.
The Hedgeye.com VIX risk range is 13.93 – 22.23.
[6-13-26: Set the SL at 7406. Tighten stops with the OB/OS declining. Take profits at the OB.]
[6-15-26: Profit stops taken at the 7619 overbought level.]
__________________
Navellier Top 5 Stocks – This Top 5 model portfolio begins each year at $100,000. The Top 5 Growth stocks are tracked throughout each year. This portfolio is reset to start at $100,000 for the 2026 year.
These Navellier Top 5 portfolio stocks closed:
Down 35% for the 2022 Year.
Up 17% for the 2023 Year.
Up 42% for the 2024 Year.
Up 48% for the 2025 Year
Portfolio stock values for 2026.
The portfolio value up for the week, at $167,000.
The Year-to-Date portfolio performance is up 67%.
The Hedgeye GDP nowcast has rising growth projected thru July, then slowing. This “up 67%” needs to be protected/taken at the first evidence of GDP slowing. Market down hard, these days are never just one day events; wait to sell into short covering, with the intent to buy back into the July Fed inflation print.
The S&P 500 YTD return is 8.02%
Market Summary:
Copper now a new short. Gold and silver both new shorts.
Crude lower. Iran very aware of the mid-term elections and happy to inflict pain on trump.
Natural Gas breakout stalling.
The US 30yr Treasury lower as the 10yr yield rises to 4.53%.
The expected overbought level for the 10yr yield declines to 4.57%.
The US Dollar – The higher yields/inflation worries are causing the equity market to sell off, sending $’s to the USD.
_________________
S&P 500 Futures #ESM26, #MESM26
Monthly –Monthly bar making new ATH’s. Trade pressures remain up, but still declining. Volumes closed the month of May as bullish. The 7632 price is the adjusted high. The next target up remains 7615. A close below 7321 would confirm any weekly move lower.
Weekly – The weekly bar higher off the Oct 31 resistance line which remains support at 7283. Trade pressures remain up. Volumes remain bullish. The next target up remains 7615. A close below 7457 would confirm any daily move lower.
Daily – Short. From 7535 on 6/5. Trade pressures are down, Volumes are bearish.
The next target down is 7262. The expected oversold level rises to 7452.
A close above 7488 would signal higher. The expected overbought level rises to 7652.
[OB/OS trend is rising.]
The VIX closes above 19 at 21.51, indicating market is in the chop/yellow zone.
The Hedgeye.com VIX risk range is 14.88 – 17.24.
[6-5-26: Set the SL at 7439. Take short profits at 7331.]
[6-7-26: Stopped out at 7439 for a gain.]
__________________
Navellier Top 5 Stocks – This Top 5 model portfolio begins each year at $100,000. The Top 5 Growth stocks are tracked throughout each year. This portfolio is reset to start at $100,000 for the 2026 year.
These Navellier Top 5 portfolio stocks closed:
Down 35% for the 2022 Year.
Up 17% for the 2023 Year.
Up 42% for the 2024 Year.
Up 48% for the 2025 Year
Portfolio stock values for 2026.
The portfolio value down for the week, at $163,000.
The Year-to-Date portfolio performance is up 63%.
The Hedgeye GDP nowcast has rising growth projected thru July, then slowing. This “up 67%” needs to be protected/taken at the first evidence of GDP slowing. Market down hard, these days are never just one day events; wait to sell into short covering, with the intent to buy back into the July Fed inflation print.
The S&P 500 YTD return is 10.79%
Market Summary:
Copper stopped out but still a new long. Gold and silver both stopped out of their long trades.
Crude lower. Natural Gas has successful breakout.
The US 30yr Treasury higher as the 10yr yield declines to 4.43%.
The expected overbought level for the 10yr yield declines to 4.68%.
The US Dollar – The lower yields are taking the USD down with them.
_________________
S&P 500 Futures #ESM26, #MESM26
Monthly –Monthly bar making new ATH’s. Trade pressures remain up, but still declining. Volumes closed the month of April as bullish. The 7611 price is the adjusted high. The next target up remains 7615. A close below 7300 would confirm any weekly move lower.
Weekly – The weekly bar higher off the Oct 31 resistance line which now becomes support. Trade pressures remain up. Volumes remain bullish. The next target up remains 7615. A close below 7436 would confirm any daily move lower.
Daily – Long. From 7468 on 5/21. Trade pressures remain up, Volumes remain bullish.
The next target up is 7634. The expected overbought level rises to 7598.
A close below 7585 would signal lower. The expected oversold level rises to 7355.
[OB/OS trend is rising.]
The VIX closes below 19 at 15.32, indicating market is investable.
The Hedgeye.com VIX risk range is 15.29 – 18.01.
[6-2-26: At 7632. Raise SL for the move up at 7550.]
[6-3-26: Stopped out at 7550.]
__________________
Navellier Top 5 Stocks – This Top 5 model portfolio begins each year at $100,000. The Top 5 Growth stocks are tracked throughout each year. This portfolio is reset to start at $100,000 for the 2026 year.
These Navellier Top 5 portfolio stocks closed:
Down 35% for the 2022 Year.
Up 17% for the 2023 Year.
Up 42% for the 2024 Year.
Up 48% for the 2025 Year
Portfolio stock values for 2026.
The portfolio value static for the week, at $167,000.
The Year-to-Date portfolio performance is up 67%.
The Hedgeye GDP nowcast has rising growth projected thru July, then slowing. This “up 67%” needs to be protected/taken at the first evidence of GDP slowing.
The S&P 500 YTD return is 10.46%
Market Summary:
Copper new long. Gold and silver new longs on 5/24.
Crude up against the 4/7 downtrend line, breaks lower in the Sunday session. Natural Gas attempts another breakout then pulls back to support.
The US 30yr Treasury higher as the 10yr yield declines to 4.55%.
The expected overbought level for the 10yr yield rises to 4.69%.
The US Dollar – Higher but meeting resistance as the 10yr seems OB..
_________________
S&P 500 Futures #ESM26, #MESM26
Monthly –Monthly bar making new ATH’s. Trade pressures remain up, but still declining. Volumes closed the month of April as bullish. The 7540 price is the adjusted high. The next target up is 7615. A close below 7229 would confirm any weekly move lower.
Weekly – The weekly bar higher off the Oct 31 resistance line which now becomes support. Trade pressures remain up. Volumes remain bullish. The next target up is 7615. A close below 7365 would confirm any daily move lower.
Daily – Long. From 7468 on 5/21. The 7441 short entry was stopped out at 7473. Trade pressures are up, Volumes are bullish.
The next target up is 7525. The expected overbought level rises to 7525.
A close below 7438 would signal lower. The expected oversold level rises to 7294.
[OB/OS trend is rising.]
The VIX closes below 19 at 16.70 indicating market is investable.
The Hedgeye.com VIX risk range is 16.44 – 18.81.
[5-23-26: Set the SL for the move up at 7477.][5-27-26: Raise the SL to 7510.]
[5-28-26: Stopped out for a gain at 7510.]
__________________
Navellier Top 5 Stocks – This Top 5 model portfolio begins each year at $100,000. The Top 5 Growth stocks are tracked throughout each year. This portfolio is reset to start at $100,000 for the 2026 year.
These Navellier Top 5 portfolio stocks closed:
Down 35% for the 2022 Year.
Up 17% for the 2023 Year.
Up 42% for the 2024 Year.
Up 48% for the 2025 Year
Portfolio stock values for 2026.
The portfolio value up for the week, at $167,000.
The Year-to-Date portfolio performance is up 67%.
The Hedgeye GDP nowcast has rising growth projected thru July, then slowing. This “up 67%” needs to be protected/taken at the first evidence of GDP slowing.
GE Vernova (GEV) will be replaced by Cenovus Energy (CVE) at the open on the next business day.
The S&P 500 YTD return is 8.77%