Featured
Market Summary:
Copper had sharp rally to resisitance. Gold rallies to the April trendline. Silver breaks out of bull flag.
Crudebreaks out of bullflag. Natural Gas remains in the pullback.
The US 30yr Treasury is again lower. The 10yr yields rise to the 4.50’s.
The US Dollar is a short.
_________________
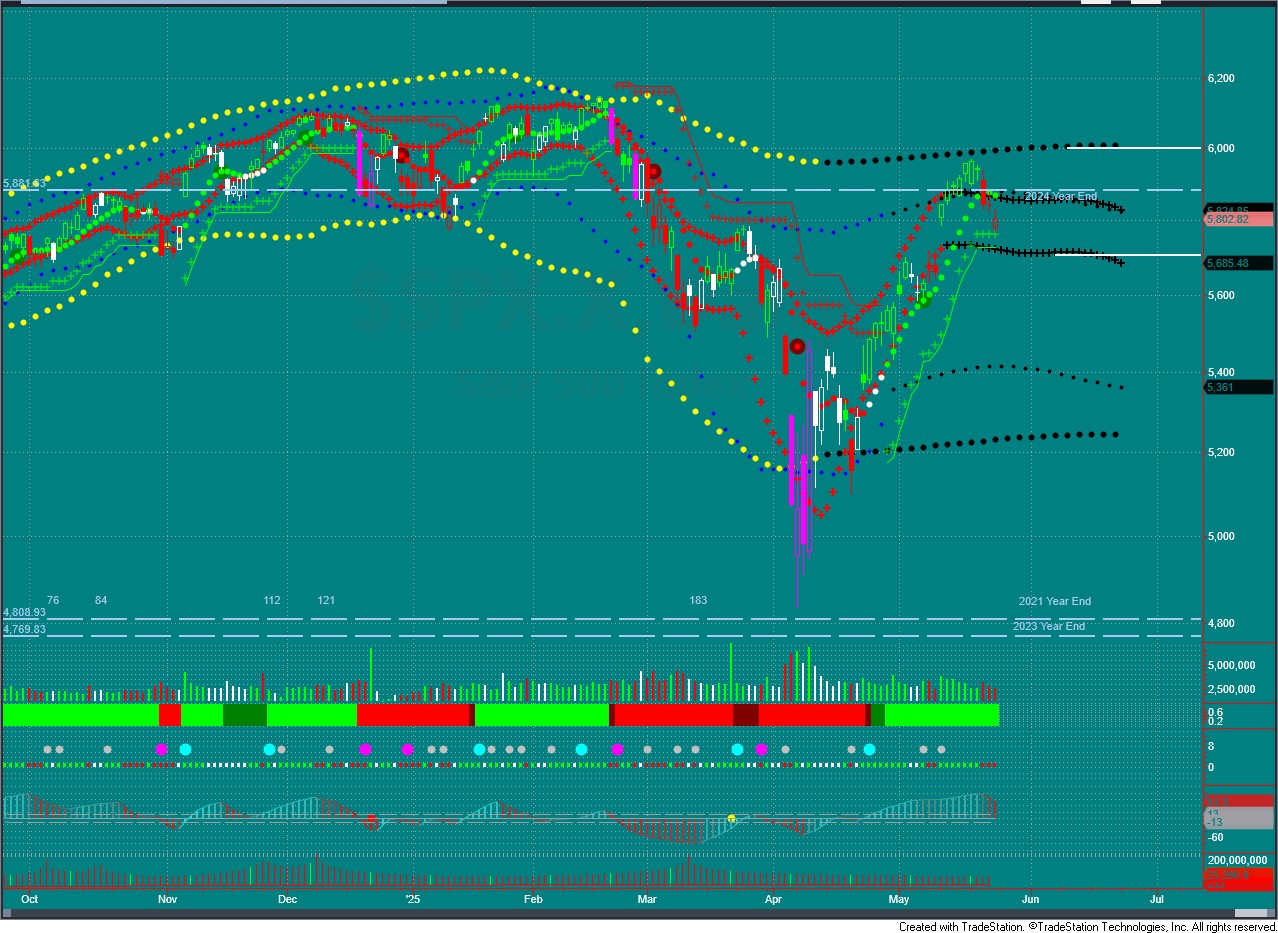
S&P 500 Futures #ESM25
Monthly –Monthly bar closes off the rally highs. Trade pressures remain in the neutral zone. Volumes closed the month of April as bullish. The 6233 price remains the adjusted high. The next target up is 6196. A close below 5754 would confirm any weekly move lower.
Weekly – The weekly bar is above the October median line, but retracing. Trade pressures rising to the neutral zone. Volumes remain bullish. The next target up is 6200. A close below 5662 would confirm any daily move lower.
Daily – Long. In the move up from 5855 on 5/26. Trade pressures are down but rising, but declining. Volumes choppy but finished the week as bullish.
A close above 5855 signaled higher. The next target up is 5976. The expected overbought level rises to 6001.
A close below 5857 would signal lower. The expected oversold level rises to 5702.
[5-26-25: Stopped out in the Memorial Day trading at 5849. Now a long trade after the bull flag breakout on the 120 min chart at 5855.]
[5-27-25: Set the SL at the BE, 5855.][Raise the SL to 5902.]
[5-28-25: Rasie the SL to 5912.]
___________________
Navellier Top 5 Stocks – This Top 5 model portfolio begins each year at $100,000. The Top 5 Growth stocks are tracked throughout each year. This portfolio is marked to the market and is restarted at $100,000 for the 2025 year.
These Navellier Top 5 portfolio stocks closed:
Down 35% for the 2022 Year.
Up 17% for the 2023 Year.
Up 42% for the 2024 Year.
Portfolio stock values for 2025.
The portfolio value is up for the week, now at $125,000.
The Year-to-Date portfolio performance is up 25%.
Monday is a US market holiday. At the next business day’s open, Agnice Eagle Mines (AEM) will be replaced by Exelixis Inc.
#usdollarfutures #ustreasurybondfutures
USD_ DXM25
Weekly – In the March 2025 downtrend. Trade pressures are down but rising. Volumes remain neutral.
Daily –Hort. the lang trade failed, but now at support. Trade pressures are down. Volumes are bearish.
The next target down is 98.53. The expected oversold levels declines to 99.03.
A close above 99.64 would signal higher. The expected overbought level declines to 101.74.
US30YR T-BOND_ USM25
Weekly – In a new April 2025 uptrend but quickly dropped to support. Trade pressures are down. Volumes remain bearish.
Daily – Flat. In the move up off the 110-01 low pivot. Trade pressures are down but rising. Volumes remain bullish.
Need a close above the bull flag at 111-18 to re-enter. The next target up is 113-15. Overbought levels are 112-20.
A close below 111-01 would signal lower. Oversold levels are 110-12.
#crudeoilfutures #naturalgasfutures
CRUDE_ CLN25
Weekly – In the April 2025 downtrend. Trade pressures are up. Volumes remain neutral.
Daily –Long. In the move up from the 61.31 entry on 5/23. Trade pressures remain down. Volumes are neutral.
The next target up is 62.60. The expected overbought levels rises to 63.88.
A close below 60.27 would signal lower. The expected oversold level rises to 60.04.
[Set the SL at 61.08.]
[5-27-25: Stopped out at the 61.08. A close above 62.03 would signal a long re-entry. Then, SL to be set at 61.29.]
NAT GAS_ NGN25
Weekly – Still in the January 2025 uptrend. Trade pressures are up into the neutral zone. Volumes are bearish.
Daily – Flat. In a move down to the 200 day MA. Trade pressures are up, but declining. Volumes are bearish.
The next target down is 3.17. The expected oversold level declines to 3.03.
A close above 3.81 would signal higher. The expected overbought level declines to 3.72.
#copperfutures #goldfutures #silverfutures
COPPER_ HGN25
Weekly – In the September 2024 uptrend. Trade pressures are up. Volumes remain bearish.
Daily – Long. In the move up from the 4.67 long entry on 5/20. Stopped out at 4.63 on 5/22. Trade pressures are up. Volumes are bullish.
Re-entered the long at 4.70 on 5/23 and at the 4.89 target. The expected overbought levels decline to 4.75.
A close below 4.78 would signal lower. The expected oversold levels rise to 4.55.
[Set the SL at 4.78.]
[5-27-25: Stopped out at the 4.78.]
GOLD_ GCM25
Weekly – In the December 2023 uptrend. Trade pressures are up, just above the neutral zone. Volumes are bullish.
Daily – Long. In the move up from 3240 on 5/20. Trade pressures are up. Volumes are bullish.
The next target up is 3401. The expected overbought level declines to 3344.
A close below 3326 would signal lower. The expected oversold level declines to 3144.
[Set the SL at the 3326 trendline.]
[5-26-25: OB. Stopped out at 3326 in the premarket hours.]
SILVER_ SIN25
Weekly – In the December 2023 uptrend. Trade pressures are up out of the neutral zone. Volumes are bullish.
Daily – Long. In the move up and out of the bull flag at 32.39 on 5/20. Stopped out in the sell-off on 5/22 at 33.33. Trade pressures are up but turning down. Volumes are bullish.
The next target up is 34.07, above the OB levels. Overbought levels rise to 33.76.
A close below 33.10 would signal lower. The oversold levels rise to 29.10.
argenx SE
argenx SE (ARGX) is a biotechnology company that develops therapies to treat patients with autoimmune diseases like Myasthenia Gravis. The company has three indications of VYVGART for the treatment of Myasthenia Gravis, and strong demand for these treatments continues to add to its top and bottom lines.
In fact, product sales jumped 98.4% year-over-year to $790.05 million in the first quarter. That crushed analysts’ expectations for $737.13 million. First-quarter earnings soared to $169.47 million, or $2.58 per share, up from a loss of $1.04 per share in the same quarter a year ago. Analysts expected earnings of $2.34 per share, so argenx posted a 10.3% earnings surprise.
Looking ahead to the second quarter, analysts have increased earnings estimates by nearly 9% in the past three months. Second-quarter earnings are now forecast to surge 543.9% year-over-year to $2.64 per share, while revenue is expected to rise 72.3% year-over-year to $776.89 million. ARGX is a Conservative buy below $630.
SOM Technicals:
2-28-25: Closed at 624.67. Trade pressures are rising into the neutral zone. Volumes are bullish. The next target up is 632.54.
3-8-25: Closed at 637.80. Trade pressures are down. Volumes are bearish. The next target down is 551.59.
3-14-25: Closed at 604.96. Trade pressures are up. Volumes are bullish. The next target 646.06. A break below 586.50 sogmals lower.
3-21-25: Closed at 615.02. Trade pressues are down into the neutral zone. Volumes are bullish. The next target up is 629.85.
3-28-25: Closed at 589.15. Trade pressures are down but rising. Volumes are neutral. The next target down is the last pivot at 562.06.
4-5-25: Closed at 555.11. Trade pressures are down into the neutral zone. Volumes are bearish. The next target down is 545.36.
4-12-25: Closed at 581.10. Trade pressures are up. Volumes are bullish. The next target up is 601.06.
4-18-25: Closed at 596.20. Trade pressures are down into the neutral zone. Volumes are bullish. The next target up is 619.00.
4-26-25: Closed at 614.76. Trade pressures are up. Volumes are bullish. The next target up is 682.42.
5-2-25: Closed at 649.67. Trade pressures are up but declining. The next target up is 682.42.
5-10-25: Closed at 549.65. Trade pressures are down hard. Volumes are neutral. The next target down is 500.42.
5-17-25: Closed at 565.73. Trade pressures are up. Volumes are bullish. The next target up is 588.62.
5-24-25: Closed at 587.61. Trade pressures are up but declining. Volumes are bullish. The next target up is 594.77.
Carpenter Technology Corporation
Carpenter Technology Corporation (CRS) develops specialty alloys, including stainless steel, nickel, cobalt, magnetic iron, powder metals and titanium. So, the company is benefiting from growth in the specialty alloys market, which is anticipated to grow at a 4.3% compound annual growth rate and reach nearly $29 billion by 2031.
Growing demand for these specialty alloys was apparent in the company’s latest quarter results. During its third quarter in fiscal year 2025, sales rose 6.1% year-over-year to $727 million. Adjusted earnings increased 53% year-over-year to a record $137.8 million, or $1.88 per share. The consensus estimate called for earnings of $1.74 per share, so Carpenter Technology posted an 8% earnings surprise.
Following the third-quarter earnings beat and the company’s increased outlook for 2025, analysts have upped fourth-quarter earnings estimates over the past three months. Fourth-quarter earnings are now expected to grow 12.6% year-over-year to $2.05 per share. CRS is a Moderately Aggressive buy below $269.
SOM Technicals:
12-13-24: Closed at 174.09. Trade pressures are down and trending. Volumes are bearish. The next target down is 150.21.
12-21-24: Closed at 169.97. Trade pressures are down. Volumes are neutral. The next target down remains 150.91.
12-27-24: Closed at 170.66. Trade pressures are up but turning down. Volumes are now neutral. The next target down is 163.00.
1-3-25: Closed at 180.13. Trade pressures are up. Volumes are bullish. The next target up is 182.64.
1-11-25: Closed at 185.96. Trade pressures are up but declining. Volumes are bullish. The next target up is 195.20.
1-18-25: Closed at 206.58. Trade pressures are up. Volumes are bullish. The next target up is 211.54.
1-24-25: Closed at 210.70. Trade pressures are up but declining. Volumes are bullish. The next target up is 213.65.
1-31-25: Closed at 193.06. Trade pressures are down. Volumes are neutral. The next target down is 178.11.
2-8-25: Closed at 187.94. Trade pressures are down. Volumes are bearish. The next target down is 178.41.
2-15-25: Closed at 188.44. Trade presures are down but rising. Volumes are bullish. The next target up is 191.93.
2-21-25: Closed at 195.10. Trde pressures are down. Volumes are bearish. The next target down is 187.98.
2-28-25: Closed at 204.07. Trade pressures are up. Volumes are bullish. Volumes are bullish. The next target up is 208.91.
3-8-25: Closed at 180.26. Trade pressures are down. Volumes are bullish. The next target down is 156.92.
3-14-25: Closed at 183.50. Trade pressures are up. Volumes are neutral. After a low of 165.14, the next target up is 186.82.
3-21-25: Closed at 183.81. Trade pressures are down. Volumes are bullish. The next target down is 176.94.
3-28-25: Closed at 181.28. Trade pressures are down. Volumes are bearish. The next target down is support at 172.30.
4-5-25: Closed at 151.66. Trade pressures are down. Volumes are neutral. The next target down is 138.16.
4-12-25: Closed at 170.88. Trade pressures are up. Volumes are neutral. The next target up is 177.31.
4-18-25: Closed at 170.21. Trade pressures are down. Volumes are bullish. The next target down is 166.51.
4-26-25: Closed at 199.00. Trade pressures are up. Volumes are neutral. The next target up is 216.00.
5-2-25: Closed at 213.01. Trade presures are up. Volumes are bullish. The next target up is 216.00.
5-10-25: Closed at 217.14. Trade pressures are up but declining. Volumes are bullish. The next target down is 197.20.
5-17-25: Closed at 231.88. Trade pressure are up. Volumes are bulish. The next target up is 234.52.
5-24-25: Closed at 230.16. Trade pressures are down. Volumes are bulish. The next target down is 217.83.
Exelixis, Inc.
Exelixis, Inc. (EXEL) was a new addition to the High-Growth Investments Buy List in the March Monthly Issue. If you recall, it’s an oncology company focused on developing new medicines to improve survival rates for patients with difficult-to-treat cancers. And Exelixis’ flagship product, CABOMETYX, serves as the foundation of its commitment to discover and develop the next generation of cancer treatments.
Thanks to increased demand for CABOMETYX, Exelixis achieved better-than-expected results for its first quarter – and it boosted its outlook for fiscal year 2025.
During the first quarter, revenue rose 30.6% year-over-year to $555.4 million, while earnings soared 245.4% year-over-year to $179.6 million, or $0.62 per share. The analyst community expected revenue of $500.96 million and earnings of $0.44 per share, so Exelixis posted a 10.9% revenue surprise and a 40.9% earnings surprise.
For fiscal year 2025, Exelixis now expects total revenue between $2.25 billion and $2.35 billion, up from previous estimates of $2.15 billion to $2.25 billion. The new outlook also represents 3.7% to 8.3% annual revenue growth. EXEL is a Conservative buy below $47.
SOM Technicals:
5-24-25: Closed at 42.39. Trade pressures are down. Volumes are bearish. The next target down is 41.31.
Palantir Technologies, Inc.
Palantir Technologies, Inc. (PLTR) specializes in data analysis, as it’s built platforms that integrate, manage and secure data – and then it layers applications on top of these platforms for human-driven, machine-assisted analysis. In addition to data analysis, though, Palantir also has several other platforms: an AI platform, the Foundry platform, the Gotham software platform and the Apollo platform.
Just this week, Palantir Technologies inked a strategic partnership with Divergent Technologies, Inc. Under the terms of the partnership, Palantir Technologies’ customers will now gain access to Divergent’s digital manufacturing solutions, which will help “identify and solve production shortages and new product developments.”
Strong demand for Palantir Technologies’ AI software also continues to add to its top and bottom lines. In fact, it drove revenue to $884 million in the first quarter, topping estimates for $862.13 million. Adjusted first-quarter earnings jumped 69.8% year-over-year to $334.4 million, or $0.13 per share, which was in line with analysts’ expectations.
Thanks to the positive first-quarter results, Palantir Technologies also increased its full-year outlook. The company now expects 2025 revenue between $3.89 billion and $3.902 billion, compared to previous estimates for $3.75 billion. In turn, analysts have also upped their second-quarter earnings estimates and now expect earnings to increase 55.5% year-over-year. PLTR is a Moderately Aggressive buy below $147.
SOM Technicals:
4-26-25: Closed at 112.70. Trade pressures are up. Volumes are bullish. The next target up is 118.66.
5-2-25: Closed at 124.28. Trade pressures are up. Volumes are bullish. The next target up is 131.06.
5-10-25: Closed at 116.72. Trade pressures are up. Volumes are neutral. The next target up down is 95.62.
5-17-25: Closed at 125.60. Trade pressures are up but declining. Volmes are bullish. The next target down is 118.67.
5-24-25: Closed at 123.31. Trade pressures are down but rising. Volumes are bearish. The next target down is 103.85.
Sprouts Farmers Market, Inc.
Sprouts Farmers Market, Inc. (SFM) offers healthy, nutritional food in the U.S. Currently, the company operates more than 440 stores, with California as its biggest market with 149 stores. The majority of its food items are natural or organic, and it also provides many gluten-free, plant-based, grass-fed, non-GMO and raw food options.
During the first quarter, Sprouts Farmers Market opened three new stores, bringing its total store count to 443 stores in 24 U.S. states. First-quarter comparable store sales grew 11.7%.
Sprouts Farmers Market also reported that total first-quarter sales increased 19% year-over-year to $2.2 billion, and earnings rose 61.6% year-over-year to $1.81 per share. The consensus estimate called for earnings of $1.55 per share on $2.21 billion in sales, so SFM posted a 16.8% earnings surprise and a slight sales surprise.
The company’s outlook also remains robust, as it expects second-quarter earnings per share between $1.19 and $1.23. That represents between 26.6% and 30.9% year-over-year earnings growth. The analyst community has also upped second-quarter earnings estimates by nearly 13% in the past three months, so another quarterly earnings surprise is likely. SFM is a Moderately Aggressive buy below $184.
SOM Technicals:
11-22-24: Closed at 147.13. Trade pressures are up. Volumes are bullish. The next target up is 148.56.
12-06-24: Closed at 154.04. Trade pressures are down into the neutral zone. Volumes are bullish. The next target up is 155.87.
12-13-24: Closed at 147.79. Trade pressures are up but turning down. Volumes are bearish. the next target down is 142.69.
12-20-24: Closed at 131.70. Trade pressures are down. Volumes are bearish. The next target down is 126.86.
12-20-24: Closed at 128.50. Trade pressures are down. Volumes are bearish. The next target down is 126.74.
1-3-25: Closed at 134.65. Trade pressures are up. Volumes are bullish. The next target up is 148.97.
1-11-25: Closed at 137.98. Trade pressures are up. Volumes are bearish. The next target down is 134.61.
1-18-25: Closed at 139.25. Trade pressures are up. Volumes are neutral. The next target up is 148.97.
1-24-25: Closed at 146.75. Trade pressures are up. Volumes are bullish. The next target up is 148.97.
1-31-25: Closed at 158.34. Trade pressures are up. Volumes are bullish. At resisitance, a move below 152.03 would signal lower.
2-8-25: Closed at 167.97. Trade pressures are up. Volumes are bullish.The next target up is 172.77.
2-15-25: Closed at 177.12. Trade pressures are up. Volum es are bullish. The next target up is 184.00.
2-21-25: Closed at 143.32. Trade pressures are down. Volumes are neutral. The next target down is 129.71.
2-28-25: Closed at 148.40. Trade pressures are up into the neutral zone. Volumes are bearish. The next target up is 156.66.
3-8-25: Closed at 136.97. Trade preessures are down. volumes are bullish. The next target down is 129.71.
3-14-25: Closed at 136.75. Trade pressure are up into the neutral zone. After a low of 30.06, the next target up is 143.51.
3-21-25: Closed at 142.39. Trade pressures are up. Volumes are bullish. The next target up is 143.51.
3-28-25: Closed at 147.76. Trade pressures are up, but turning down. Volumes are neutral. The next target down is support at 134.86.
4-5-25: Closed at 145.29. Trade pressures are down. Volumes are bearish. The next target down is 142.96.
4-12-25: Closed at 157.27. Trade pressures are up. Volumes are bullish. The next target up is 163.31.
4-18-25: Closed at 160.99. Trade pressures are up but declioning. Volumes are bullish. The next target up is 163.31.
4-26-25: Closed at 167.54. Trade pressures are up. Volumes are bullish. The next target up is 174.51.
5-2-25: Closed at 173.83. Trade pressures are up. Volumes are bearish. The next target up is 183.87.
5-10-25: Closed at 161.77. Trade pressures are down. Volumes are bearish. The next target down is 153.60.
5-17-25: Closed at 167.42. Trade pressures are up. Volumes are bullish. The next target up is 174.56.
5-24-25: Closed at 163.43. Trade pressures are down. Volum es are bearish. The next target down is 153.69.
Market Summary:
Copper holding above the 200 day MA. Gold crashes. Silver is still consolidating at the 200 day MA.
Crude meets resisitance, retraces. Natural Gas pulls back.
The US 30yr Treasury is lower, short covering. The 10yr yields rise to the 4.40’s.
The US Dollar is a long.
_________________
S&P 500 Futures #ESM25
Monthly –Monthly bar continues to rally. closing well above the prior month high. Trade pressures remain in the neutral zone. Volumes closed the month of April as bullish. The 6283 price remains the adjusted high. The next target up is 6196. A close below 5769 would confirm any weekly move lower.
Weekly – The weekly bar moves higher and now breaks above the October median line. Trade pressures remain down, but rising. Volumes are bullish. The next target up is 6407. A close below 5646 would confirm any daily move lower.
Daily – Long. In a break out move up from 5815 on 5/12. Trade pressures are up. Volumes are bullish.
The next target up is 6051, with resistance at 5991. The expected overbought level rises to 5998.
A close below 5909 would signal lower. The expected oversold level rises to 5609.
___________________
Navellier Top 5 Stocks – This Top 5 model portfolio begins each year at $100,000. The Top 5 Growth stocks are tracked throughout each year. This portfolio is marked to the market and is restarted at $100,000 for the 2025 year.
These Navellier Top 5 portfolio stocks closed:
Down 35% for the 2022 Year.
Up 17% for the 2023 Year.
Up 42% for the 2024 Year.
Portfolio stock values for 2025.
The portfolio value is down for the week, now at $124,000.
The Year-to-Date portfolio performance is up 24%.
#usdollarfutures #ustreasurybondfutures
USD_ DXM25
Weekly – In the March 2025 downtrend. Trade pressures are down but rising. Volumes remain neutral.
Daily –Long. In the new uptrend at 98.79 on 5/8. Trade pressures are up. Volumes are bullish.
The next target up is 102.90. The expected overbought level rises to 102.12.
A close below 100.47 would signal lower. The expected oversold levels rise to 99.03.
US30YR T-BOND_ USM25
Weekly – In a new April 2025 uptrend but quickly dropped to support. Trade pressures are down. Volumes remain bearish.
Daily – Flat. Retraced the move up, back down to test the low pivot. Trade pressures are down but rising. Volumes are now bullish.
Need a close above the bull flag at 114-27 to re-enter. The next target up is 117-15. Overbought levels are 115-06.
A close below 113-05 would signal lower, but wait for a back test of the 113-15. Oversold levels are 111-04.
#crudeoilfutures #naturalgasfutures
CRUDE_ CLN25
Weekly – In the April 2025 downtrend. Trade pressures are down. Volumes are now neutral.
Daily –Flat. In the move up from the 58.15 entry on 5/8. In the pull back. Trade pressures are down. Volumes remain bullish.
Met resistance at 63.00, Look for a pull back below 59.00 to re-enter long. The expected overbought levels rises to 63.67.
The next target down is 58.65. The expected oversold level rises to 56.51.
NAT GAS_ NGM25
Weekly – Still in the January 2025 uptrend. Trade pressures are up into the neutral zone. Volumes are neutral.
Daily – Flat. In the move up from the 3.00 low pivot touching the 3.77 long entry level; and is now pulling back to support at 3.30. Trade pressures are down. Volumes are bearish.
The next target down is 3.20. The expected oversold level rises to 3.25.
A close above 3.40 would signal higher. The expected overbought level declines to 3.78.
#copperfutures #goldfutures #silverfutures
COPPER_ HGN25
Weekly – In the September 2024 uptrend. Trade pressures are down. Volumes remain bearish.
Daily – Short. In the move down from the 4.63 short entry on 5/16. Trade pressures are down. Volumes are bullish.
The next target down is 4.31. The expected oversold levels rise to 4.49.
A close above 4.67 would signal higher. The expected overbought levels decline to 4.79.
GOLD_ GCM25
Weekly – In the December 2023 uptrend. Trade pressures remain up. Volumes remain bearish.
Daily – Flat. In the move down from the gap open at 3281 on 5/12 (missed this trade). Trade pressures are down. Volumes are bearish.
The next target down is 3145. The expected oversold level declines to 3153.
A close above 3240 would signal a resumption of the move up. The expected overbought level declines to 3401.
SILVER_ SIN25
Weekly – In the December 2023 uptrend. Trade pressures are down. Volumes are bearish.
Daily – Flat. Consolidating at the 200 day MA and forming a bull flag. Trade pressures are down. Volumes are neutral.
still holding the 200 day; else a short. The next target down is 31.530. The oversold levels rise to 29.10.
A close above the bull flag at 32.29 would signal higher. Overbought levels rise to 33.76.