Featured
Market Summary:
Copper at OS support. Gold and Silver in consolidation.
Crude moves higher on Yemeni threats of red sea transit closure. Natural Gas moves up slowly.
The US 30yr Treasury – Oversold. A break above the downward channel boundary remains the objective,
The 10yr yield at 4.97%. The expected overbought level for the 10yr yield at 4.98%.
The US Dollar – The USD a new short entry. War$’s + rising crude + rising interst rates + rising inflation
_________________
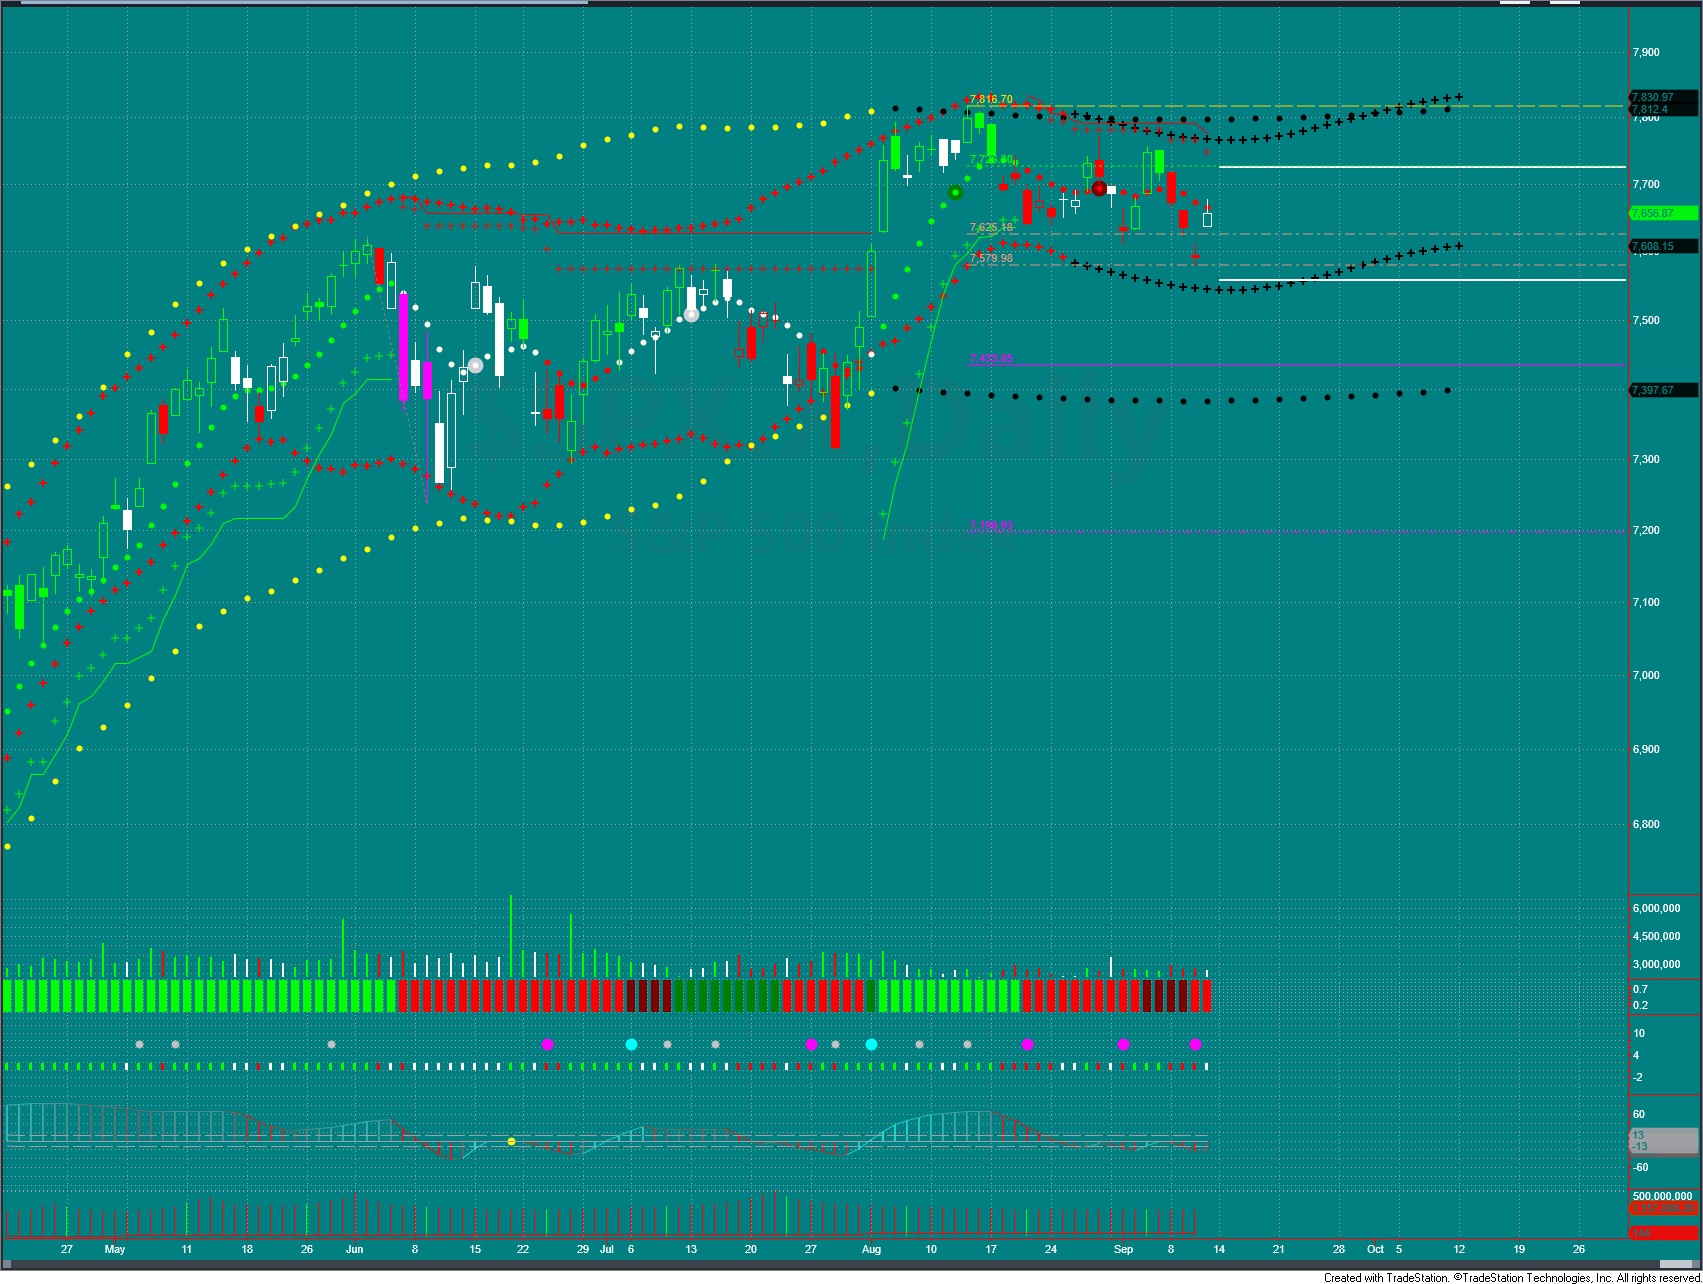
S&P 500 Futures #ESZ26, #MESZ26 (DEC26 contract change)
Monthly –Monthly bar now below the prior month. Trade pressures remain up, Volumes closed the month of August as bullish. The 7906 price is the new high. The next target up is 8752. A close below 7575 would confirm any weekly move lower.
Weekly – The weekly bar below the prior week’s close. Trade pressures remain up, but declining. Volumes are now bullish. The next target down is 7615. A close below 7615 would confirm any daily move lower.
Daily – Flat. 4th rally to the upper median parallel in attempt to break out. Trade pressures are down, but rising, Volumes are bullish.
The next target down is 7609. The expected oversold level declines to 7565.
A close above 7743 would confirm signal higher to 7824. 9/13, testing this resistance again. The expected overbought level declines to 7730.
[OB/OS channel is declining.]
The VIX closes below 19, at 15.80 indicating market remains investable.
The Hedgeye.com VIX risk range is 14.33 – 18.77.
__________________
Navellier Top 5 Stocks – This Top 5 model portfolio begins each year at $100,000. The Top 5 Growth stocks are tracked throughout each year. This portfolio is reset to $100,000 for the 2026 year.
These Navellier Top 5 portfolio stocks closed:
Down 35% for the 2022 Year.
Up 17% for the 2023 Year.
Up 42% for the 2024 Year.
Up 48% for the 2025 Year
Portfolio stock values for 2026.
The portfoliodeclines to $189,000.
The Year-to-Date portfolio performance is up 89%.
The Hedgeye.com GDP nowcast has GDP growth slowing and inflation rising (Quad 3) in the 3rd quarter, re-accelerating in the 4th quarter with both growth and inflation rising and slowing once again in the 1st quarter of 2027.
6/26 – Now all cash for the summer; re-entering late July or early August, or re-entering if Navellier adds more defensive names.
7/25 – Quad shift (GDP and Inflation) to Quad 3 from a Quad 4 is likely in early August. Will look to re-enter positions.
8/2 – Re-entering the new Top 5 at the next open. CIEN, DINO, ENLT, MU, STX.
8/29 – replace Sinclair (DINO), Enlight Renewable Energy (ENLY), and Seagate Tech (STX) with Marathon Petro (MPC), PhillIps 66 (PSX), and San Disk (SNDK) at the next open.
The S&P 500 YTD return is 10.90%
#usdollarfutures #ustreasurybondfutures
USD_ DXZ26
Weekly – In the March 2026 uptrend. Trade pressures are down, but rising. Volumes are beaerish.
Daily – Flat. In the new move up from 98.66 on 9/10. Trade pressures are up. Volumes are neutral.
The next target up is 98.99. The expected overbought level declines to 99.17.
A close below 9864 would signal lower. The expected oversold levels decline to 98.40.
[The OB/OS channel is declining.]
US30YR T-BOND_ USU26
Weekly – In the March 2026 downtrend, breaking below lower channel bound. Trade pressures are down, but slowly rising. Volumes remain bearish.
Daily – Flat. Remains in the downward channel. Trade pressures are down. Volumes are bearish.
The next target down is 106-01. Oversold levels decline to 106-25.
The next channel breakout and long entry is 107-10. Overbought levels decline to 109-08.
[The OB/OS channel is declining.]
[9-13-16: 10yr yields rise to 4.97%. The yield overbought level rises to 4.98.]
#crudeoilfutures #naturalgasfutures
CRUDE_ CLV26
Weekly – In the new September 2026 up trend. Trade pressures remain up. Volumes remain bullish.
Daily – Flat. ripped thru the 92 target to a new high off 104.16 on 9/11.. Trade pressures are up. Volumes are now neutral.
The next target up is 107.19. The expected overbought levels rise to 102.99.
A close below 88.87 would signal lower. The expected oversold level rises to 88.57.
[OB/OS channel is rising.]
OVX (oil volatility) rises to 59.
(One of the larger components in the measure of inflation.The Hedgeye.com inflation nowcast now expects inflation rising, slowly, thru the year end. Rises in the GDP are also expected.)
NAT GAS_ NGV26
Weekly – In the August 2026 downtrend. Trade pressures are up. Volumes are now neutral.
Daily – Flat, Basing with a likely long entry at 2.84. Trade pressures are up. Volumes are bullish.
The next target up is 2.93. The expected overbought level declines to 2.99.
A close below 2.77 would signal lower. The expected oversold level declines to 2.71.
[OB/OS channel is declining.]
Natural gas is produced with oil production. Natural gas production as a ratio of oil production has been rising; amounted to 47% of the Permian Basin oil production in 2024.
#copperfutures #goldfutures #silverfutures
COPPER_ HGZ26, MHGZ26
Weekly – In the October 2025 uptrend. Trade pressures are up, but declining. Volumes are bearish.
Daily –Flat. Did break above the 67 level, but the retest of that breakout failed and price tumbled to support at 6.49 on 9/10.
Trade pressures are down. Volumes are again neutral.
Now near the OS levels; so may expect a bounce. But the declining weekly cautions against any entry. The expected overbought level rises to 6.84.
A close below 6.58 would signal lower. The expected oversold levels decline to 6.35.
[OB/OS channel is widening.]
[9-13-26: expect increasing volatility.]
GOLD_ GCZ26, MGCZ26
Weekly – In the new August 2026 uptrend. Trade pressures down and declining. Volumes remain bullish.
Daily – Flat. In the move down from 4508 and the 200 day on 8/28. Trade pressures are down. Volumes are bullish.
The next target down is 4257. The expected oversold level declines to 4276.
A close above 4438 would signal higher. The expected overbought level declines to 4503.
[OB/OS channel is declining.] GVX @ 25 = investable. The 30 level would indicate Chop.
[9-13-26: Gold is sensitive to interest rates. The 10yr yield is now OB; so any decline in rates would set up a new long for Currency equivalent metals.]
SILVER_ SIZ26
Weekly – In the June 2026 downtrend. Trade pressures are down. Volumes are bearish.
Daily – Flat. The next target up from 64.42 is 66.30 (resistance). Trade pressures are downp. Volumes are bullish.
After the 9/10 drop. now in a new move up off the 63.15 low. Overbought levels rise to 70.
A close below 63.48 would signal lower. The oversold levels hold at 62.
[OB/OS channel is widening.]
Market Summary:
Copper at resistance, In a narrow range, readying for up or down. Gold and Silver moves down to consolidation area.
Crude moves up off retest of breakout levels. Natural Gas moves up slowly.
The US 30yr Treasury – A break above the downward channel boundary remains the objective,
The 10yr yield at 4.78%. The expected overbought level for the 10yr yield at 4.84%.
The US Dollar – The USD a new short entry. Treasury actions?
_________________
S&P 500 Futures #ESU26, #MESU26
Monthly –Monthly bar close remains above prior month. Trade pressures remain up, Volumes closed the month of August as bullish. The 7838 price is the new high. The next target up is 8684. A close below 7507 would confirm any weekly move lower.
Weekly – The weekly bar at the prior week’s close. Trade pressures remain up, but declining. Volumes are now bullish. The next target down is 7667. A close below 7590 would confirm any daily move lower.
Daily – Flat. Another rally to the upper median parallel in attempt to break out. This is also another potential lower high. Trade pressures are up, Volumes remain bearish.
A close above 7764 would signal higher to 7838. Testing this resistance now. The expected overbought level declines to 7781.
The next target down remains 7638. The expected oversold level rises to 7652.
[OB/OS channel is narrowing.]
The VIX closes below 19, at 14.53 indicating market remains investable.
The Hedgeye.com VIX risk range is 13.75 – 16.33.
__________________
Navellier Top 5 Stocks – This Top 5 model portfolio begins each year at $100,000. The Top 5 Growth stocks are tracked throughout each year. This portfolio is reset to $100,000 for the 2026 year.
These Navellier Top 5 portfolio stocks closed:
Down 35% for the 2022 Year.
Up 17% for the 2023 Year.
Up 42% for the 2024 Year.
Up 48% for the 2025 Year
Portfolio stock values for 2026.
The portfolio rises to $190,000.
The Year-to-Date portfolio performance is up 90%.
The Hedgeye.com GDP nowcast has GDP growth slowing and inflation rising (Quad 3) in the 3rd quarter, re-accelerating in the 4th quarter with both growth and inflation rising and slowing once again in the 1st quarter of 2027.
6/26 – Now all cash for the summer; re-entering late July or early August, or re-entering if Navellier adds more defensive names.
7/25 – Quad shift (GDP and Inflation) to Quad 3 from a Quad 4 is likely in early August. Will look to re-enter positions.
8/2 – Re-entering the new Top 5 at the next open. CIEN, DINO, ENLT, MU, STX.
8/29 – replace Sinclair (DINO), Enlight Renewable Energy (ENLY), and Seagate Tech (STX) with Marathon Petro (MPC), PhillIps 66 (PSX), and San Disk (SNDK) at the next open.
The S&P 500 YTD return is 13.18%
#usdollarfutures #ustreasurybondfutures
USD_ DXU26
Weekly – In the March 2026 uptrend. Trade pressures are down, but rising. Volumes are neutral.
Daily – Long. In the new move down from 99.45 on 9/2. Trade pressures are down. Volumes remain bullish.
The next target down is 98.42. The expected oversold levels rise to 98.51.
The next target up is 100.35. The expected overbought level rises to 99.67.
[The OB/OS channel is rising.]
[9-3-26: US Treasury buying US Treasuries and Japanese Yen trying to get rates down before the election. Rarely works.]
US30YR T-BOND_ USU26
Weekly – In the March 2026 downtrend, at the lower channel bound. Trade pressures are down, but rising. Volumes remain bearish.
Daily – Flat. Remains in the downward channel. Trade pressures are up. Volumes are bearish.
The next target down is 107-16. Oversold levels decline to 107-14.
The next channel breakout and long entry is 109-00. Overbought levels decline to 109-21.
[The OB/OS channel is declining.]
10yr yields rise to 4.78%. The yield overbought level rises to 4.84.
#crudeoilfutures #naturalgasfutures
CRUDE_ CLV26
Weekly – In the new June 2026 down trend and at resistance. Trade pressures remain up. Volumes remain bullish.
Daily – Flat. In the pullback after the 93.14 high pivot on 9/3. Trade pressures are up. Volumes remain bullish.
The next target up is 92.60. The expected overbought levels rise to 94.63.
A close below 88.87 would signal lower. The expected oversold level rises to 84.74.
[OB/OS channel is rising.]
OVX (oil volatility) rises to 45.
(One of the larger components in the measure of inflation.The Hedgeye.com inflation nowcast now expects inflation rising, slowly, thru the year end.)
NAT GAS_ NGV26
Weekly – In the August 2026 downtrend. Trade pressures are up. Volumes are now bullish.
Daily – Flat, Rallying to retest the breakdown from 2.97 on 9/3. Trade pressures are up. Volumes are bullish.
The next target up is 3.05. The expected overbought level rises to 3.05.
A close below 2.88 would signal lower. The expected oversold level rises to 2.82.
[OB/OS channel is rising.]
Natural gas is produced with oil production. Natural gas production as a ratio of oil production has been rising, amounting to 47% of the Permian Basin oil production in 2024.
#copperfutures #goldfutures #silverfutures
COPPER_ HGZ26, MHGZ26
Weekly – In the October 2025 uptrend. Trade pressures are up, but declining. Volumes remain bullish.
Daily –Flat. The pullback from the lower high at 6.85 on 8/26 has found support at 6.49 on 9/2.
Trade pressures are up. Volumes are neutral.
The close above 6.61 on 9/2 has triggered a new move up. But, OB/OS levels are declining – Wait. The expected overbought level declines to 6.75.
A close below 6.58 would signal lower. The expected oversold levels decline to 6.40.
[OB/OS channel is declining.]
[9-5-26: A close above 67 would be a breakout above the upper parallel resistance.]
GOLD_ GCZ26, MGCZ26
Weekly – In the new August 2026 uptrend. Trade pressures are up, but declining. Volumes are now bullish.
Daily – Flat. In the move up from support at 4317 on 9/2. Trade pressures are up. Volumes are bullish.
The next target up is 4630, which is also resistance. The expected overbought level declines to 4691.
A close below 4383 would signal lower. The expected oversold level declines to 4296.
[OB/OS channel is declining.] GVX @ 26 = investable. The 30 level would indicate Chop.
SILVER_ SIZ26
Weekly – In the June 2026 downtrend. Trade pressures are up, but turning down. Volumes remain bullish.
Daily – Flat. In the move up from 66.08 on 9/2. OB/OS is declining. Trade pressures are up. Volumes are bearish.
The next target up is 68.38, with resistance at 67.95. Overbought levels decline to 69.
A close below 65.50 would signal lower. The oversold levels decline to 62.
[OB/OS channel is declining.]
Market Summary:
Copper in a pullback after a run to 66.84. Gold and Silver huge rally, now followed by a sharp drop..
Crude breaks out and now retesting the breakout area. Natural Gas continues basing.
The US 30yr Treasury rises to test the cannel boundary, The 10yr yield at 4.72%.
The expected overbought level for the 10yr yield at 4.76%.
The US Dollar – The USD a new long entry.
_________________
S&P 500 Futures #ESU26, #MESU26
Monthly –Monthly bar new high and the close remains above prior month. Trade pressures remain up, Volumes closed the month of July as bullish. The 7838 price is the new high. The next target up is 8684. A close below 7507 would confirm any weekly move lower.
Weekly – The weekly bar retraces sme of the selloff. Trade pressures remain up, but declining. Volumes remain neutral. The next target down is 7667. A close below the 7590 would confirm any daily move lower.
Daily – Flat. A rally to the upper median line followed by a another selloff; establishes a lower high. Trade pressures are up, Volumes remain bearish.
The next target down remains 7638. The expected oversold level rises to 7620.
A close above 7782 would signal higher. The expected overbought level declines to 7788.
[OB/OS channel is widening.]
The VIX closes below 19, at 14.56 indicating market remains investable.
The Hedgeye.com VIX risk range is 14.26 – 16.47.
__________________
Navellier Top 5 Stocks – This Top 5 model portfolio begins each year at $100,000. The Top 5 Growth stocks are tracked throughout each year. This portfolio is reset to $100,000 for the 2026 year.
These Navellier Top 5 portfolio stocks closed:
Down 35% for the 2022 Year.
Up 17% for the 2023 Year.
Up 42% for the 2024 Year.
Up 48% for the 2025 Year
Portfolio stock values for 2026.
The portfolio declines to $182,000.
The Year-to-Date portfolio performance is up 82%.
The Hedgeye.com GDP nowcast has GDP growth slowing and inflation rising (Quad 3) in the 3rd quarter, re-accelerating in the 4th quarter and slowing once again in the 1st quarter of 2027.
6/26 – Now all cash for the summer; re-entering late July or early August, or re-entering if Navellier adds more defensive names.
7/25 – Quad shift (GDP and Inflation) to Quad 3 from a Quad 4 is likely in early August. Will look to re-enter positions.
8/2 – Re-entering the new Top 5 at the next open. CIEN, DINO, ENLT, MU, STX.
8/29 – replace Sinclair (DINO), Enlight Renewable energy (ENLY), and Seagate Tech (STX) with Marathon Petro (MPC), PhillIps 66 (PSX), and San Disk (SNDK) at the next open.
The S&P 500 YTD return is 12.94%